

Without Volume Confirmation, There Is No Breakthrough
Bitcoin Technical Analysis: Week of November 24-28, 2025

A breakout without volume is noise, not signal.
In Ichimoku analysis, a trend change requires two validations working in harmony: the Lagging Span (Chikou) must cross its reference lines—particularly the Kijun—to confirm that current price action aligns with the market’s 26-period memory, and volume must exceed its moving average (ideally 150-200%) to prove the collective behavior is committed, not tentative.
When the Lagging Span breaks above the Kijun while volume surges, it signals that both the mathematical structure (equilibrium shift) and participant conviction (capital commitment) are aligned—this is when trend changes become sustainable rather than ephemeral.
Conversely, when the Lagging Span validates a breakout but volume remains below 100% of its average, the market is showing structural improvement without emotional commitment—a dangerous divergence that typically results in failed breakouts and consolidation rather than continuation.
This is precisely what Bitcoin demonstrated this week: Wednesday’s Kijun break at $87k was validated by the 4-hour Lagging Span and 203% volume (real conviction), but Friday’s test of $92-93k came with only 50-94% volume (structural test without commitment), resulting in rejection and return to the $88-92k range. The mathematics can show where equilibrium should shift, but volume shows whether the collective behavior will shift.
As Karen Péloille teaches: price action without volume confirmation is noise; when the Lagging Span crosses the Kijun with strong volume, it’s signal. One is observation, the other is validation—and only validation changes trends.
THE WEEK IN ONE SENTENCE
Bitcoin held above $80,537, broke the daily Kijun at $87k on Wednesday with conviction, and will most likely close the week at an average of $91,610 (+7.6% from Monday’s low)—confirming Scenario 1 (consolidation) as the collective behavior establishes new equilibrium between $88-92k.
MONDAY, NOVEMBER 24: FEAR
Price opened at $87,500 (Sunday close) and immediately rejected lower to $85,153. The collective behavior tested whether Friday’s breakdown would accelerate.
Key level: $85,400 (2H cloud bottom) held as support. Volume remained below average - continued distribution but no panic.
Verdict: Market searching for support after breaking the weekly cloud for first time in 763 days.
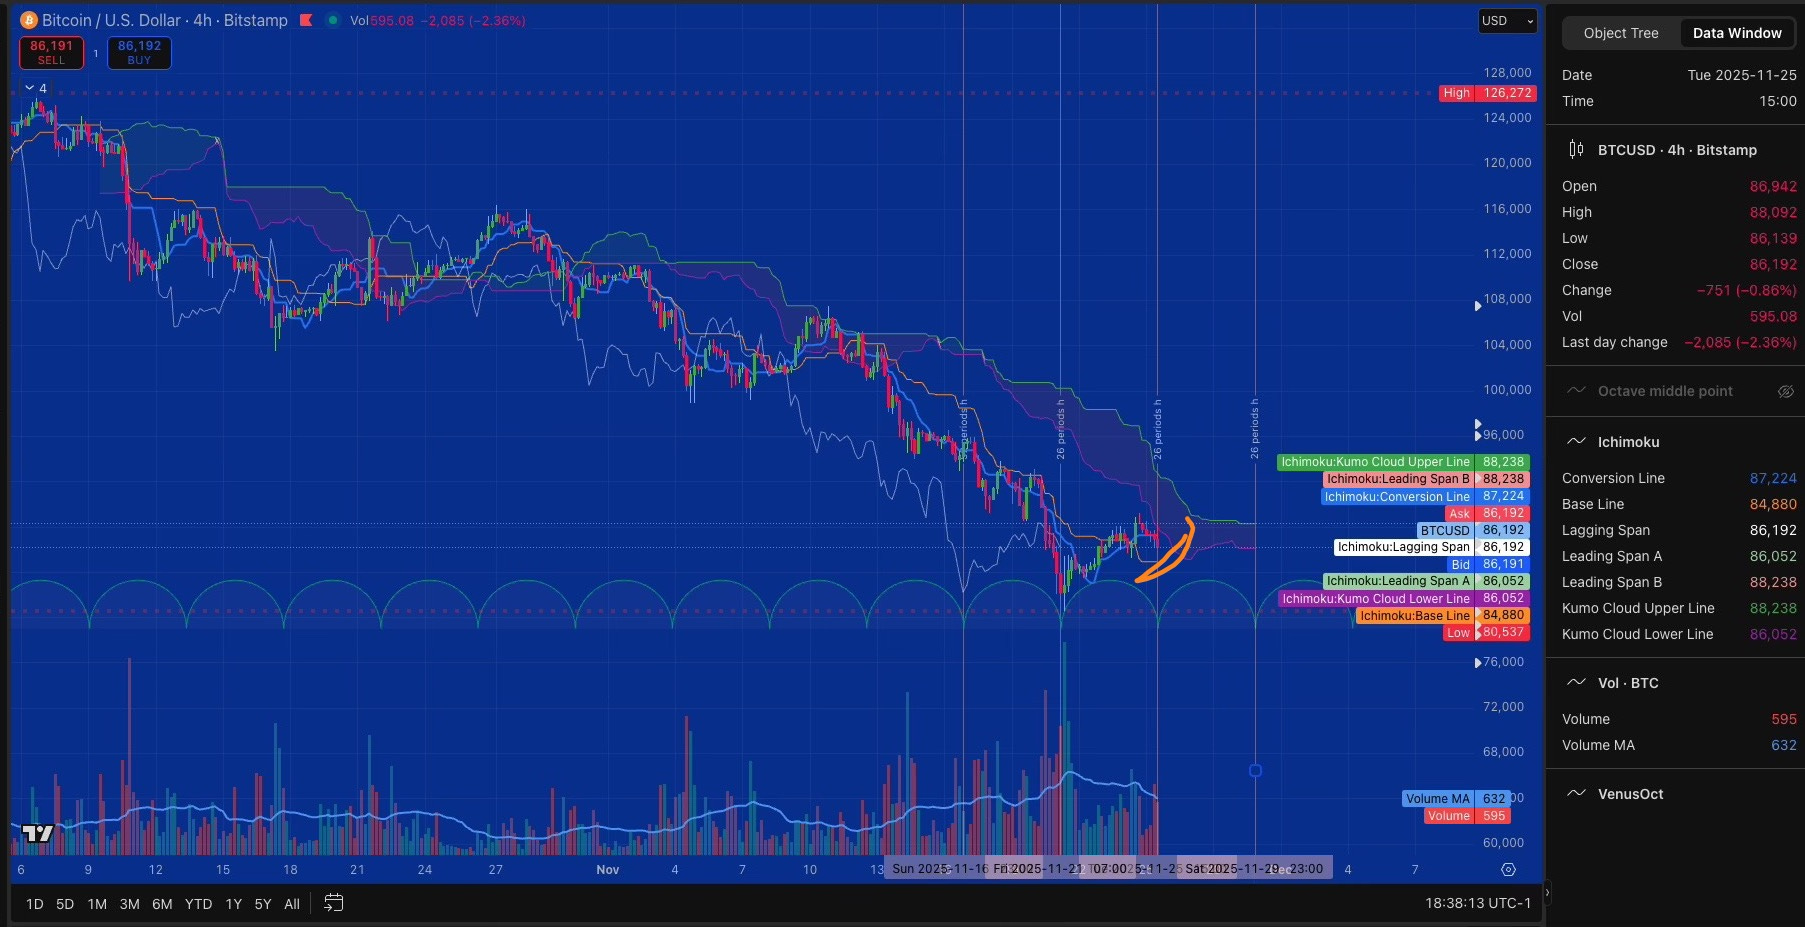
TUESDAY, NOVEMBER 25: EXHAUSTION
Price consolidated $86-88k. Red volume at 2.87K/3.18K (91% MA) showed selling pressure exhausted. No conviction to buy, no energy to sell lower.
Collective behavior: Waiting pattern. Market paused, testing whether recovery was possible or if another leg down would come.
Verdict: Exhaustion phase—the calm before direction emerges.
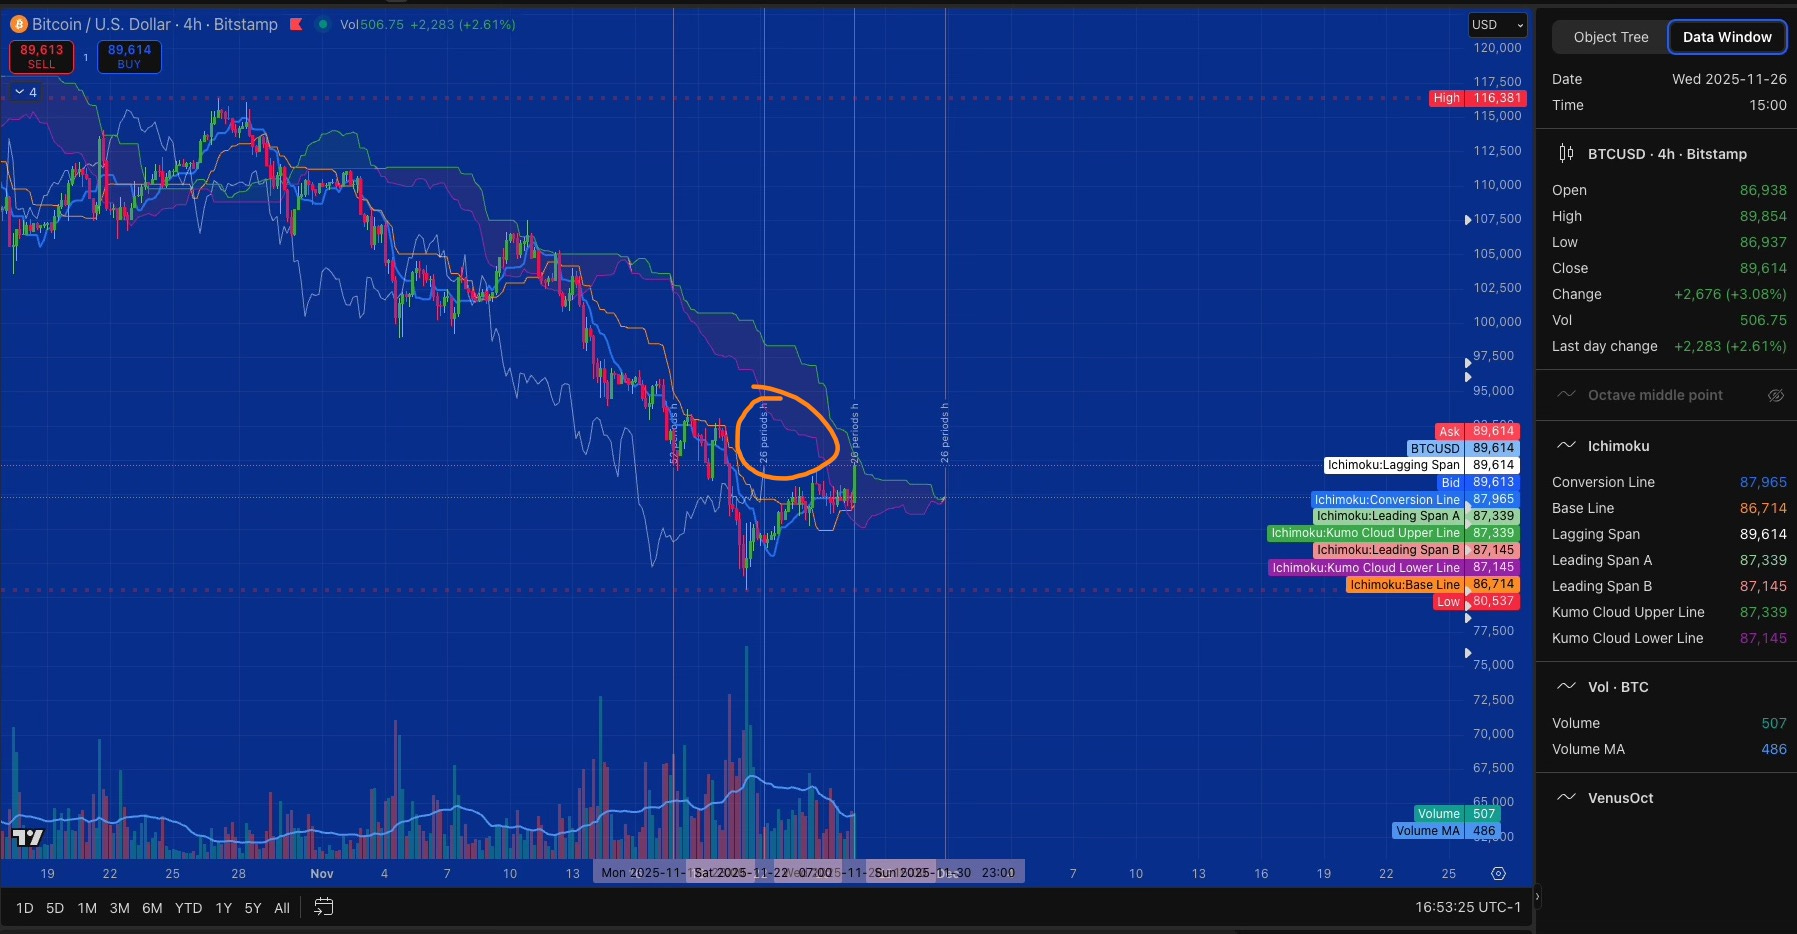
WEDNESDAY, NOVEMBER 26: THE TURNING POINT
This was the week’s critical moment. Price broke above the daily Kijun at $87k, rallying to $90,477. Volume improved to 94% MA on the daily—not exceptional, but building.
The 4-hour timeframe delivered the validation signal:
3 PM: Large green candle with 203% volume (502 vs 247 MA)
Broke above both Kijun ($89k) and Tenkan ($89k)
7 PM: Price broke decisively above the 4H cloud at $88,845
For the first time since November 21’s breakdown, Bitcoin was above the 4-hour cloud with Lagging Span confirmation.
Why this mattered: The Lagging Span validated the Kijun break—structure AND conviction aligned. This wasn’t just price spiking; it was the market’s 26-period memory confirming the move.
Verdict: First real buying conviction since the historic breakdown. Recovery validated on lower timeframes.
THURSDAY, NOVEMBER 27: THANKSGIVING PAUSE
Small green Doji formed at $90,666. Volume collapsed to 42% MA as U.S. markets closed for Thanksgiving holiday.
Critical observation: Price held above all of Wednesday’s broken levels. No panic selling, no breakdown retest, no invalidation. The structure remained intact despite holiday thinness.
What the Doji showed: Not reversal—consolidation. The market was digesting Wednesday’s gains with minimal participation.
Verdict: Healthy pause. Cannot read conviction on a holiday, but holding support was bullish.
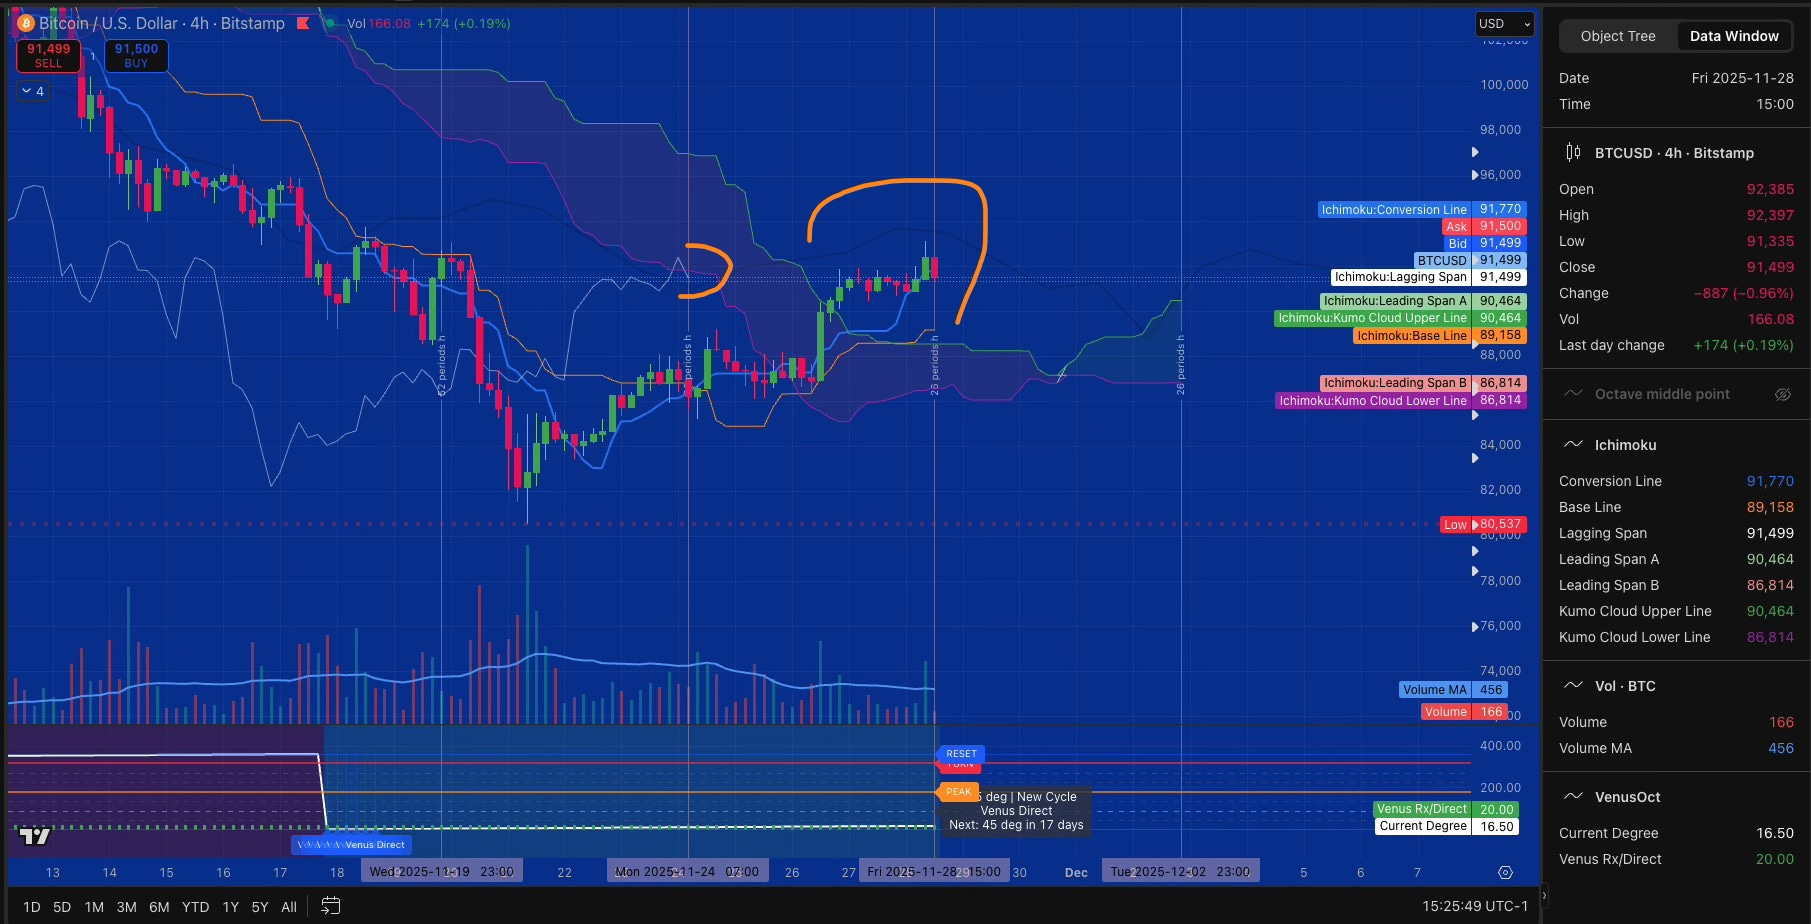
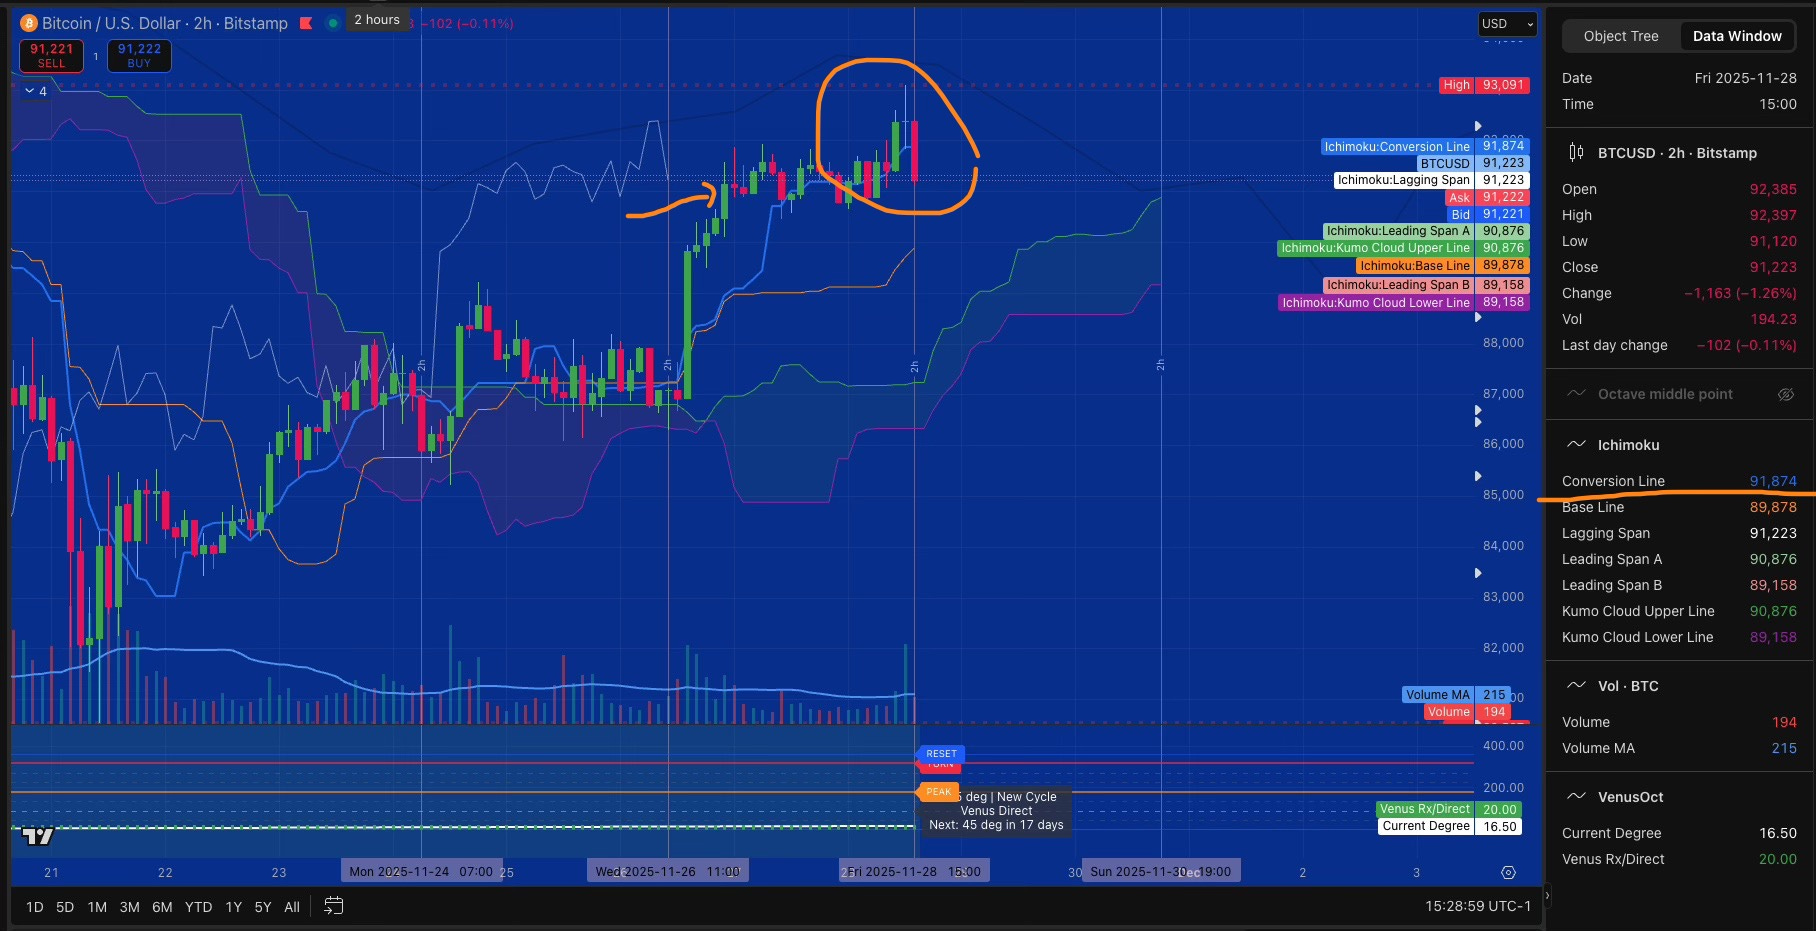
FRIDAY, NOVEMBER 28: TESTING RESISTANCE
Morning rally: Price pushed to $93,091 high, testing the exact level predicted Thursday: $92k, where the 4H Lagging Span would enter its cloud.
The problem: Volume at only 50-94% MA across timeframes. Structure showed price could break higher. Volume showed the collective behavior wouldn’t commit yet.
Afternoon rejection: Price pulled back to $91,398, then consolidated into weekend close at $90,677.
Weekly candle closed: $91,610 (green) with volume 13.49K vs 12.24K MA = 110%—first time above average this week.
What Friday proved: The mathematics showed where resistance existed ($92-93k confluence: 4H Lagging Span cloud entry + daily cloud approach). But without volume above 150% MA, the breakout attempt failed.
Verdict: Structure improved (price above 4H cloud, Lagging Span validated), but conviction insufficient to break next resistance. New equilibrium establishing $88-92k range.
STRUCTURAL SHIFTS
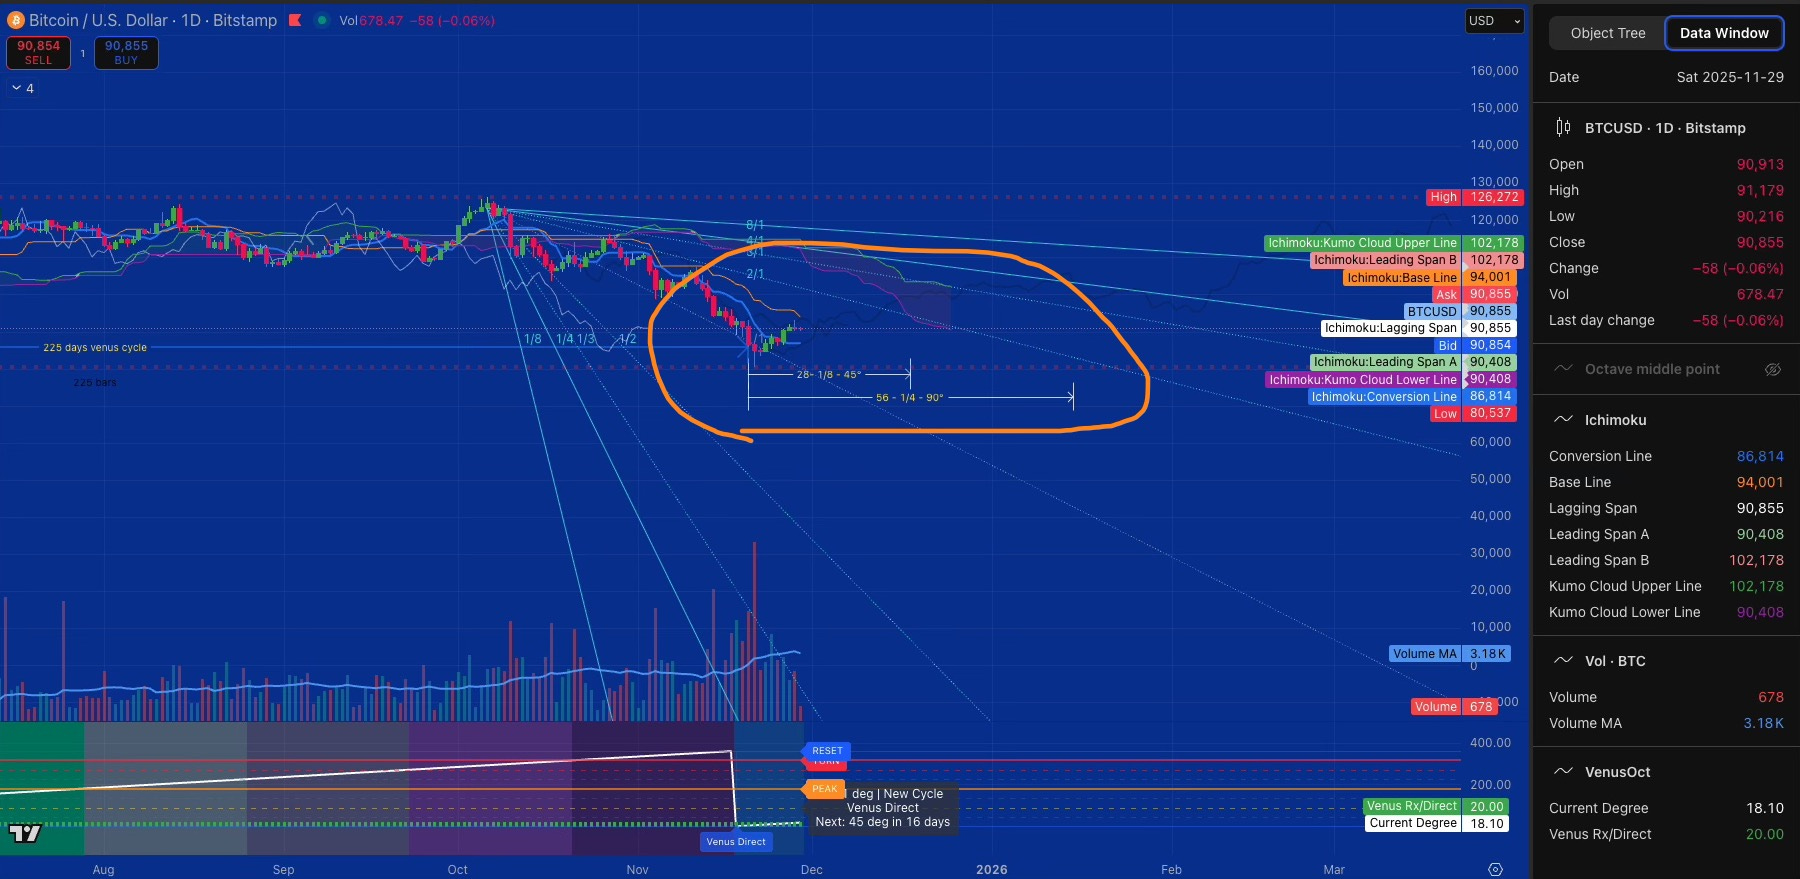
DAILY TIMEFRAME:
Broke Kijun at $87k (Wednesday) ✓
Price: $90,677
Kijun (now support): $87,145
Cloud bottom: $90,408
Cloud top: $102,178
Lagging Span: $90,677 (free, no obstacles)
Status: Improving—above Kijun, testing cloud bottom
4-HOUR TIMEFRAME:
Broke above cloud (Wednesday 7 PM) ✓
Lagging Span validated (reached cloud at $92k Friday) ✓
Support: $88,500-89,000 (Kijun/cloud confluence)
Resistance tested: $92-93k
Status: Bullish structure—price above cloud, support established
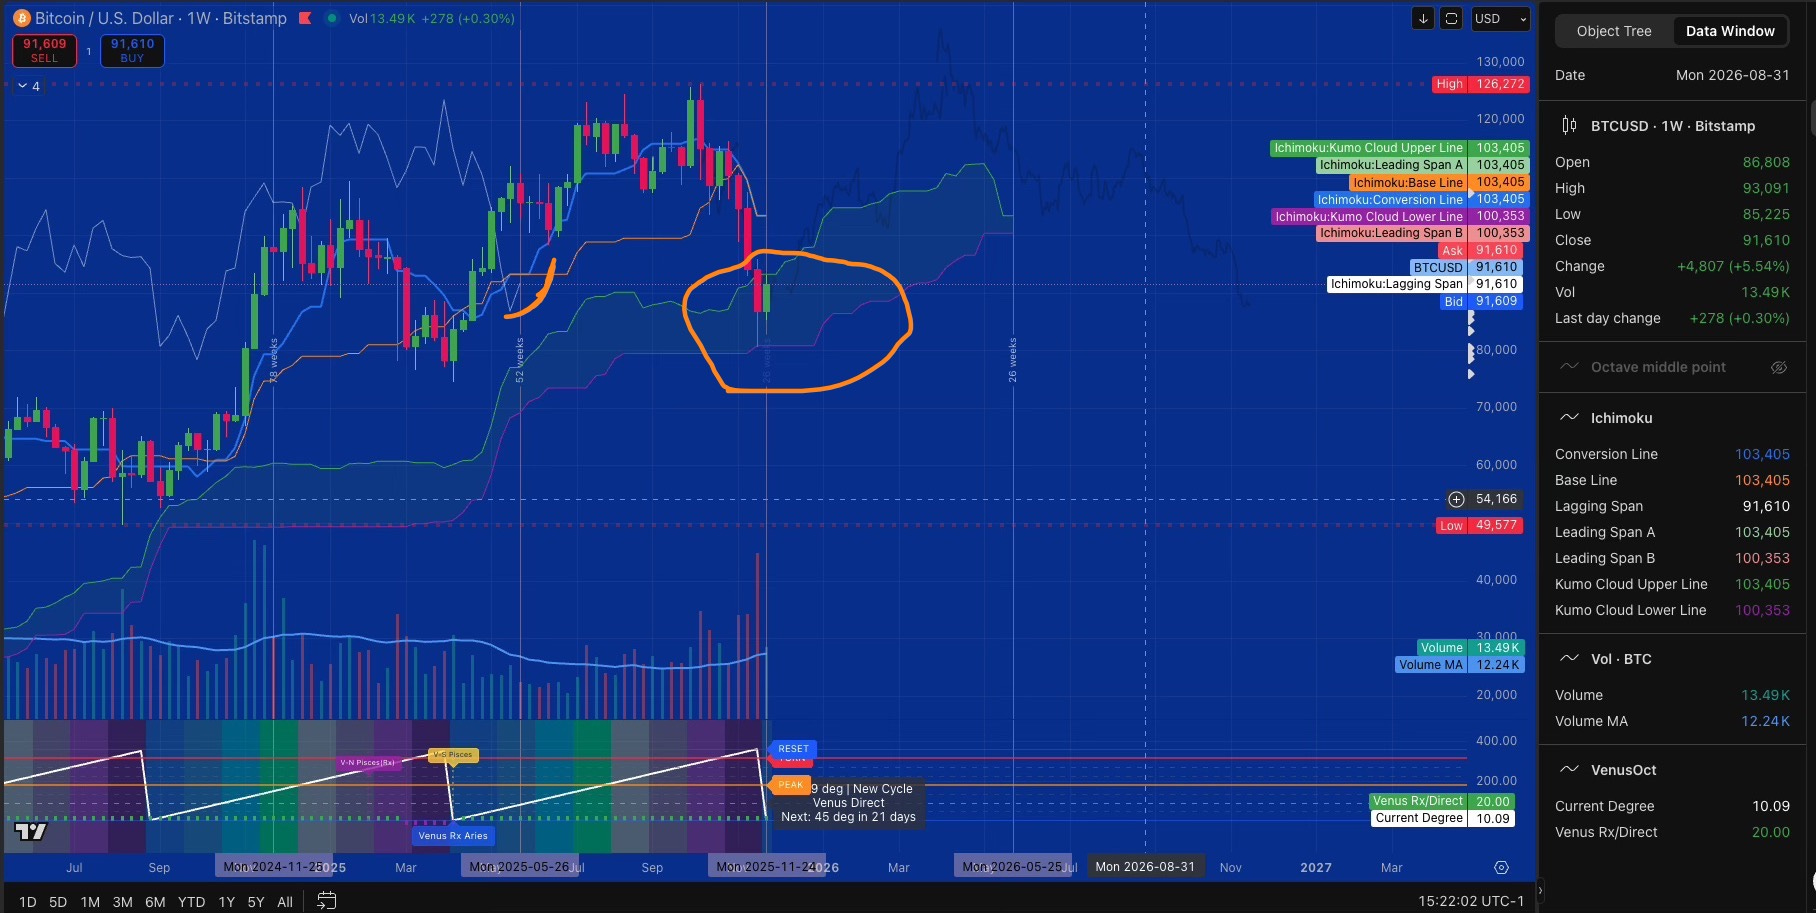
WEEKLY TIMEFRAME:
Closed: $91,610 (green)
Volume: 110% MA ✓ (first time above average)
Candle: Long lower wick from $80,537 (buyer defense)
Cloud bottom: $100,353 (still above, not broken)
Status: Recovery candle, but still below weekly cloud
Timeline: 36 weeks (August 2026) remains active
SCENARIO CONFIRMATION
Scenario 1 (Consolidation $87-95k): WINNING
What Validated This Week:
✓ Held above $80,537 all week
✓ Held above $85,400 Monday support
✓ Broke daily Kijun at $87k with Lagging Span validation
✓ Broke 4H cloud with volume confirmation
✓ Weekly volume above MA (110%)
✓ Weekly candle closed green with bullish structure
What’s Still Pending:
Daily cloud break (testing $90,408 bottom)
Higher resistance at $94k (daily Kijun)
Volume sustaining above 100% MA
New Equilibrium: $88-92k range forming. Below $88,500 = recovery fails. Above $92k with volume = acceleration toward $95-100k.
Timeline Status: Above $80,537, the market has maximum time (36 weeks until August 2026) before weekly Lagging Span enters cloud. This week proved Friday’s $80,537 low was capitulation, not the start of bear acceleration.
THE LEVELS
RESISTANCE:
$92-93k (tested Friday, rejected—4H Lagging Span cloud + daily cloud approach)
$94-95k (daily Kijun zone)
$100,353 (weekly cloud bottom)
SUPPORT:
$88,500-89,000 (4H Kijun/cloud—critical hold)
$87,145 (daily Kijun, now support)
$85,400 (Monday’s defense)
$80,537 (absolute line—36-week timeline anchor)
VENUS CYCLE UPDATE
Current Degree: 18.10
Next 45° leg: December 15 (16 days)
New 224-day cycle began this week. Previous cycle ended precisely at Monday/Tuesday lows around $88,500, confirming spatial forecasting from November 9th.
Cyclical Significance: The cycle resetting at $88-91k levels (not $100k+) suggests the mathematical rhythm is establishing equilibrium at these lower levels for the next phase. This supports consolidation rather than immediate return to previous highs.
WHAT I DID RIGHT THIS WEEK
1. Called the $92k Target Exactly (Thursday, November 27)
Timeframe: 4H
“If the Kijun crosses 92,000 in 12 hours, we’re going to be entering the cloud.”
Result: Friday morning hit $92,606 and the 4H Lagging Span reached its cloud at exactly that level. Precise spatial forecasting using Ichimoku projection.
2. Identified the $88-92k Range Early (Thursday, November 27)
Timeframe: Multi-timeframe analysis
“I have a feeling we’re gonna keep between 88-90, even 92 a bit.”
Result: Price consolidated exactly in this range. Instinct matched mathematical structure—$88,500 support (4H Kijun/cloud) and $92-93k resistance (4H Lagging Span cloud entry + daily cloud approach).
3. Recognized Wednesday’s Kijun Break Importance (November 26)
Timeframe: Daily
Correctly identified that Wednesday’s candle crossing the blue Kijun line at $87k was the key validation signal—not just a random move up. This was the week’s turning point.
4. Multi-Timeframe Discipline (All week)
Daily → 4H → 2H → 45min
Systematically checked all timeframes following Karen Péloille’s methodology: starting from higher timeframe for context, then zooming to lower for execution and validation.
5. Lagging Span Validation Focus (All week)
All timeframes
Tracked: “Chikou is pretty free below price, below cloud, below everything, and just needed to keep on popping up.” Understanding that Lagging Span confirmation separates real moves from noise.
6. Volume Awareness (Thursday-Friday)
All timeframes
Consistently noted when volume was above/below MA. Understood low Thanksgiving volume meant “can’t read conviction today”—didn’t mistake holiday thinness for bearish sentiment.
7. Chart Reading Discipline
When analysis contained errors, I immediately checked actual charts and corrected with proof. Reading actual price action, not just accepting explanations.
MY BIGGEST STRENGTH
I trust the mathematics over hope.
I’m not asking “will it go up because I want it to?” I’m asking “where does equilibrium exist mathematically?”
Karen Péloille teaches: “Charts represent collective behavior.” That behavior broke 763 days of weekly cloud support. Now we observe where it finds balance again.
That’s the difference between analysis with hope and analysis with discipline.
Most Important: Caught the week’s turning point (Wednesday’s Kijun break at $87k, Daily timeframe) in real-time. That’s the skill that matters.
SATURDAY’S OBSERVATION: CONSOLIDATION CONTINUES
Saturday morning confirmed the sideways action predicted Thursday. Price at $90,677, exactly mid-range between support at $88,500 and resistance at $92-93k.
Multi-Timeframe Status:
Daily: Between Kijun support ($87k) and cloud bottom ($90k)
4H: Lagging Span in cloud, testing if it breaks through or reverses
2H: Critical—Lagging Span approaching Kijun; break below would invalidate recovery
45min: Bearish structure, price at cloud edge
Volume: Low across all timeframes—weekend effect.
The Key Question: Was this week just “testing the waters” or real recovery?
The Answer Depends On:
Does 2H Lagging Span hold above Kijun? (validates)
Does 4H Lagging Span break through its cloud? (validates)
Does price hold $89,584 (4H Kijun) support? (validates)
Monday’s open will show conviction. Weekend is low participation—the real test comes when institutional volume returns.
CONCLUSION: WEEK 1 POST-BREAKDOWN
The collective behavior this week:
Monday: Fear testing if breakdown continues
Tuesday: Exhaustion of selling pressure
Wednesday: First real recovery conviction
Thursday: Consolidation holding structure
Friday: Testing resistance, finding ceiling without volume
Saturday: Sideways, waiting for Monday
The week shifted from “will we break $80k again?” to “can we hold $87-95k and build?”
Price gained $6,457 (+7.6%) from Monday’s low. More importantly, structure improved across all timeframes. Wednesday’s Kijun break with 203% volume and Lagging Span validation confirmed this wasn’t just a dead cat bounce.
But Friday’s rejection at $92-93k with sub-100% volume proved: Without volume confirmation, there is no breakthrough.
New equilibrium is forming between $88-92k. The mathematics show the support (4H cloud/Kijun at $88,500) and resistance (4H Lagging Span cloud + daily cloud at $92k). Volume will determine which way it breaks.
Next week’s question: Does consolidation continue to build energy, or does it break in either direction?
Bullish case: Hold $88,500, build volume above 100% MA, break $92k with conviction = path to $95-100k opens
Bearish case: Fail below $88,500, volume confirms breakdown = retest $85-87k, possible $80k
Most likely: Consolidation continues. New equilibrium takes time to establish after historic breakdown. The 36-week timeline suggests patience, not urgency.
Charts represent collective behavior. This week, that behavior said: “We’re not going lower immediately. We’re finding new balance.”
Equilibrium is a process. This week was phase one: stabilization. Next week will show if consolidation holds or breaks.
The mathematics show the range. Volume will show the direction.
Analysis by Monika Bravo | November 29, 2025 | monikabravo.blog
Frameworks: Ichimoku Kinko Hyo (Karen Péloille methodology), Venus Cycles, Volume Analysis
“Looking for Equilibrium, Not Hope” - Equilibrium is a Process Series
Week of November 24-28, 2025 | Learning Documentation

