Looking for Equilibrium, Not Hope:
Charts Represent Collective Behavior”

Bitcoin Technical Analysis - November 17-23, 2025
Weekly Summary:
Bitcoin broke below the weekly cloud for the first time in 763 days, falling from 97k to 80,537 before recovering to 87k. The week revealed an early warning signal from May 2025 easy to have missed: the weekly Lagging Span crossing below the Kijun six months before price confirmed the breakdown. This analysis examines what collective behavior told us, what it’s telling us now, and what to expect as price searches for new equilibrium.
Buy more Sats is my thing, they are more accessible.
The Philosophy First
Charts don’t show hope. They show collective behavior—the aggregate decisions of millions of participants expressing themselves through price and volume. When we analyze Bitcoin through Ichimoku Kinko Hyo, we’re not predicting where price should go. We’re observing where equilibrium exists, where it’s breaking, and where it will likely reform.
Hope says: “I think it will go up because I want it to.”
Equilibrium says: “The mathematics show where balance exists. Price will find that level regardless of what I want.”
This week, that equilibrium broke in a way not seen since October 2023. Understanding why requires looking backward before we can look forward.
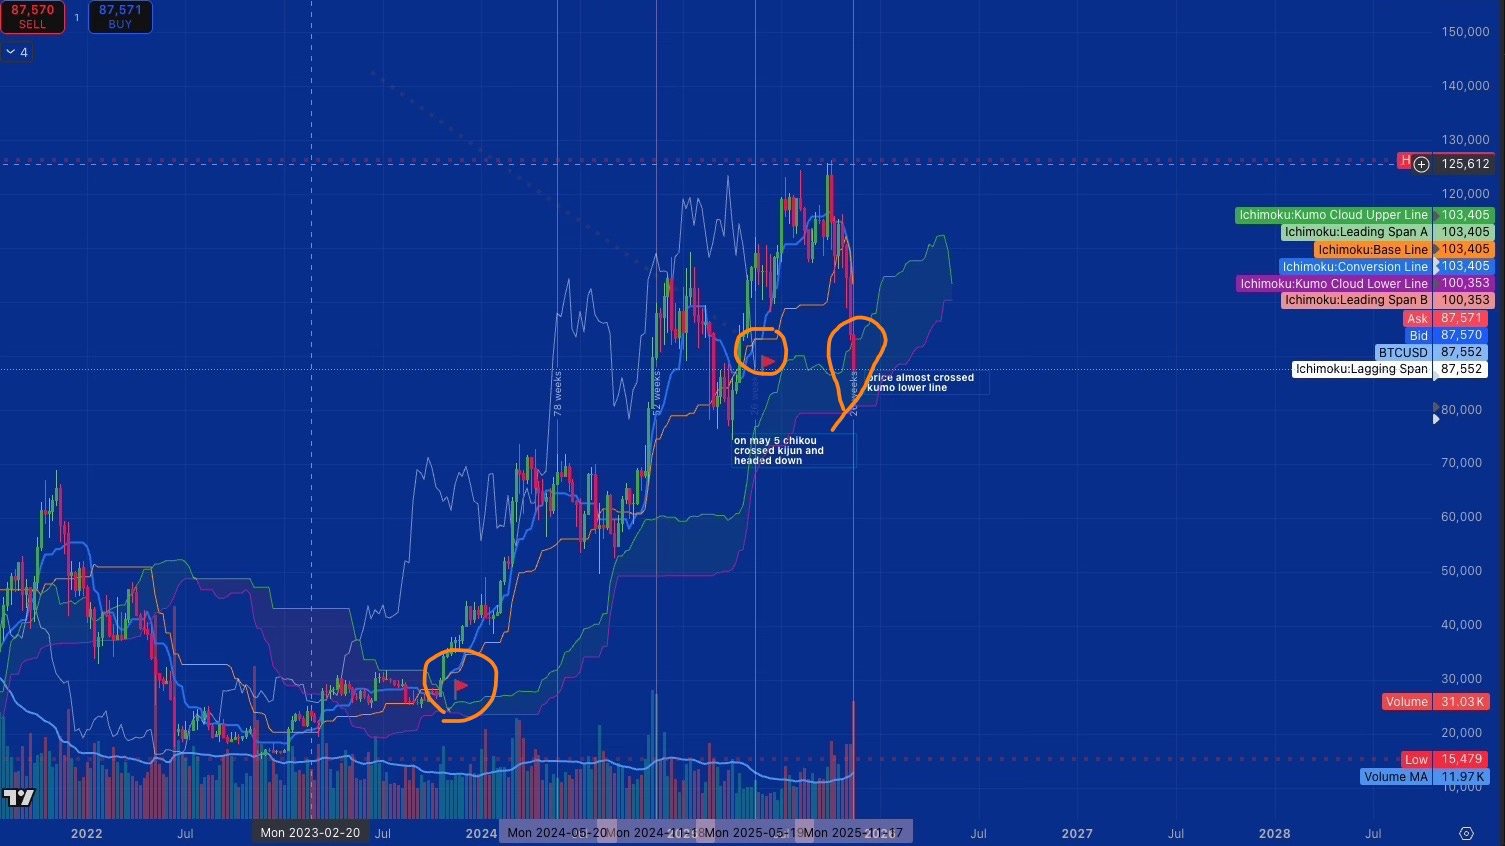
Where the Market’s Memory Now Sits
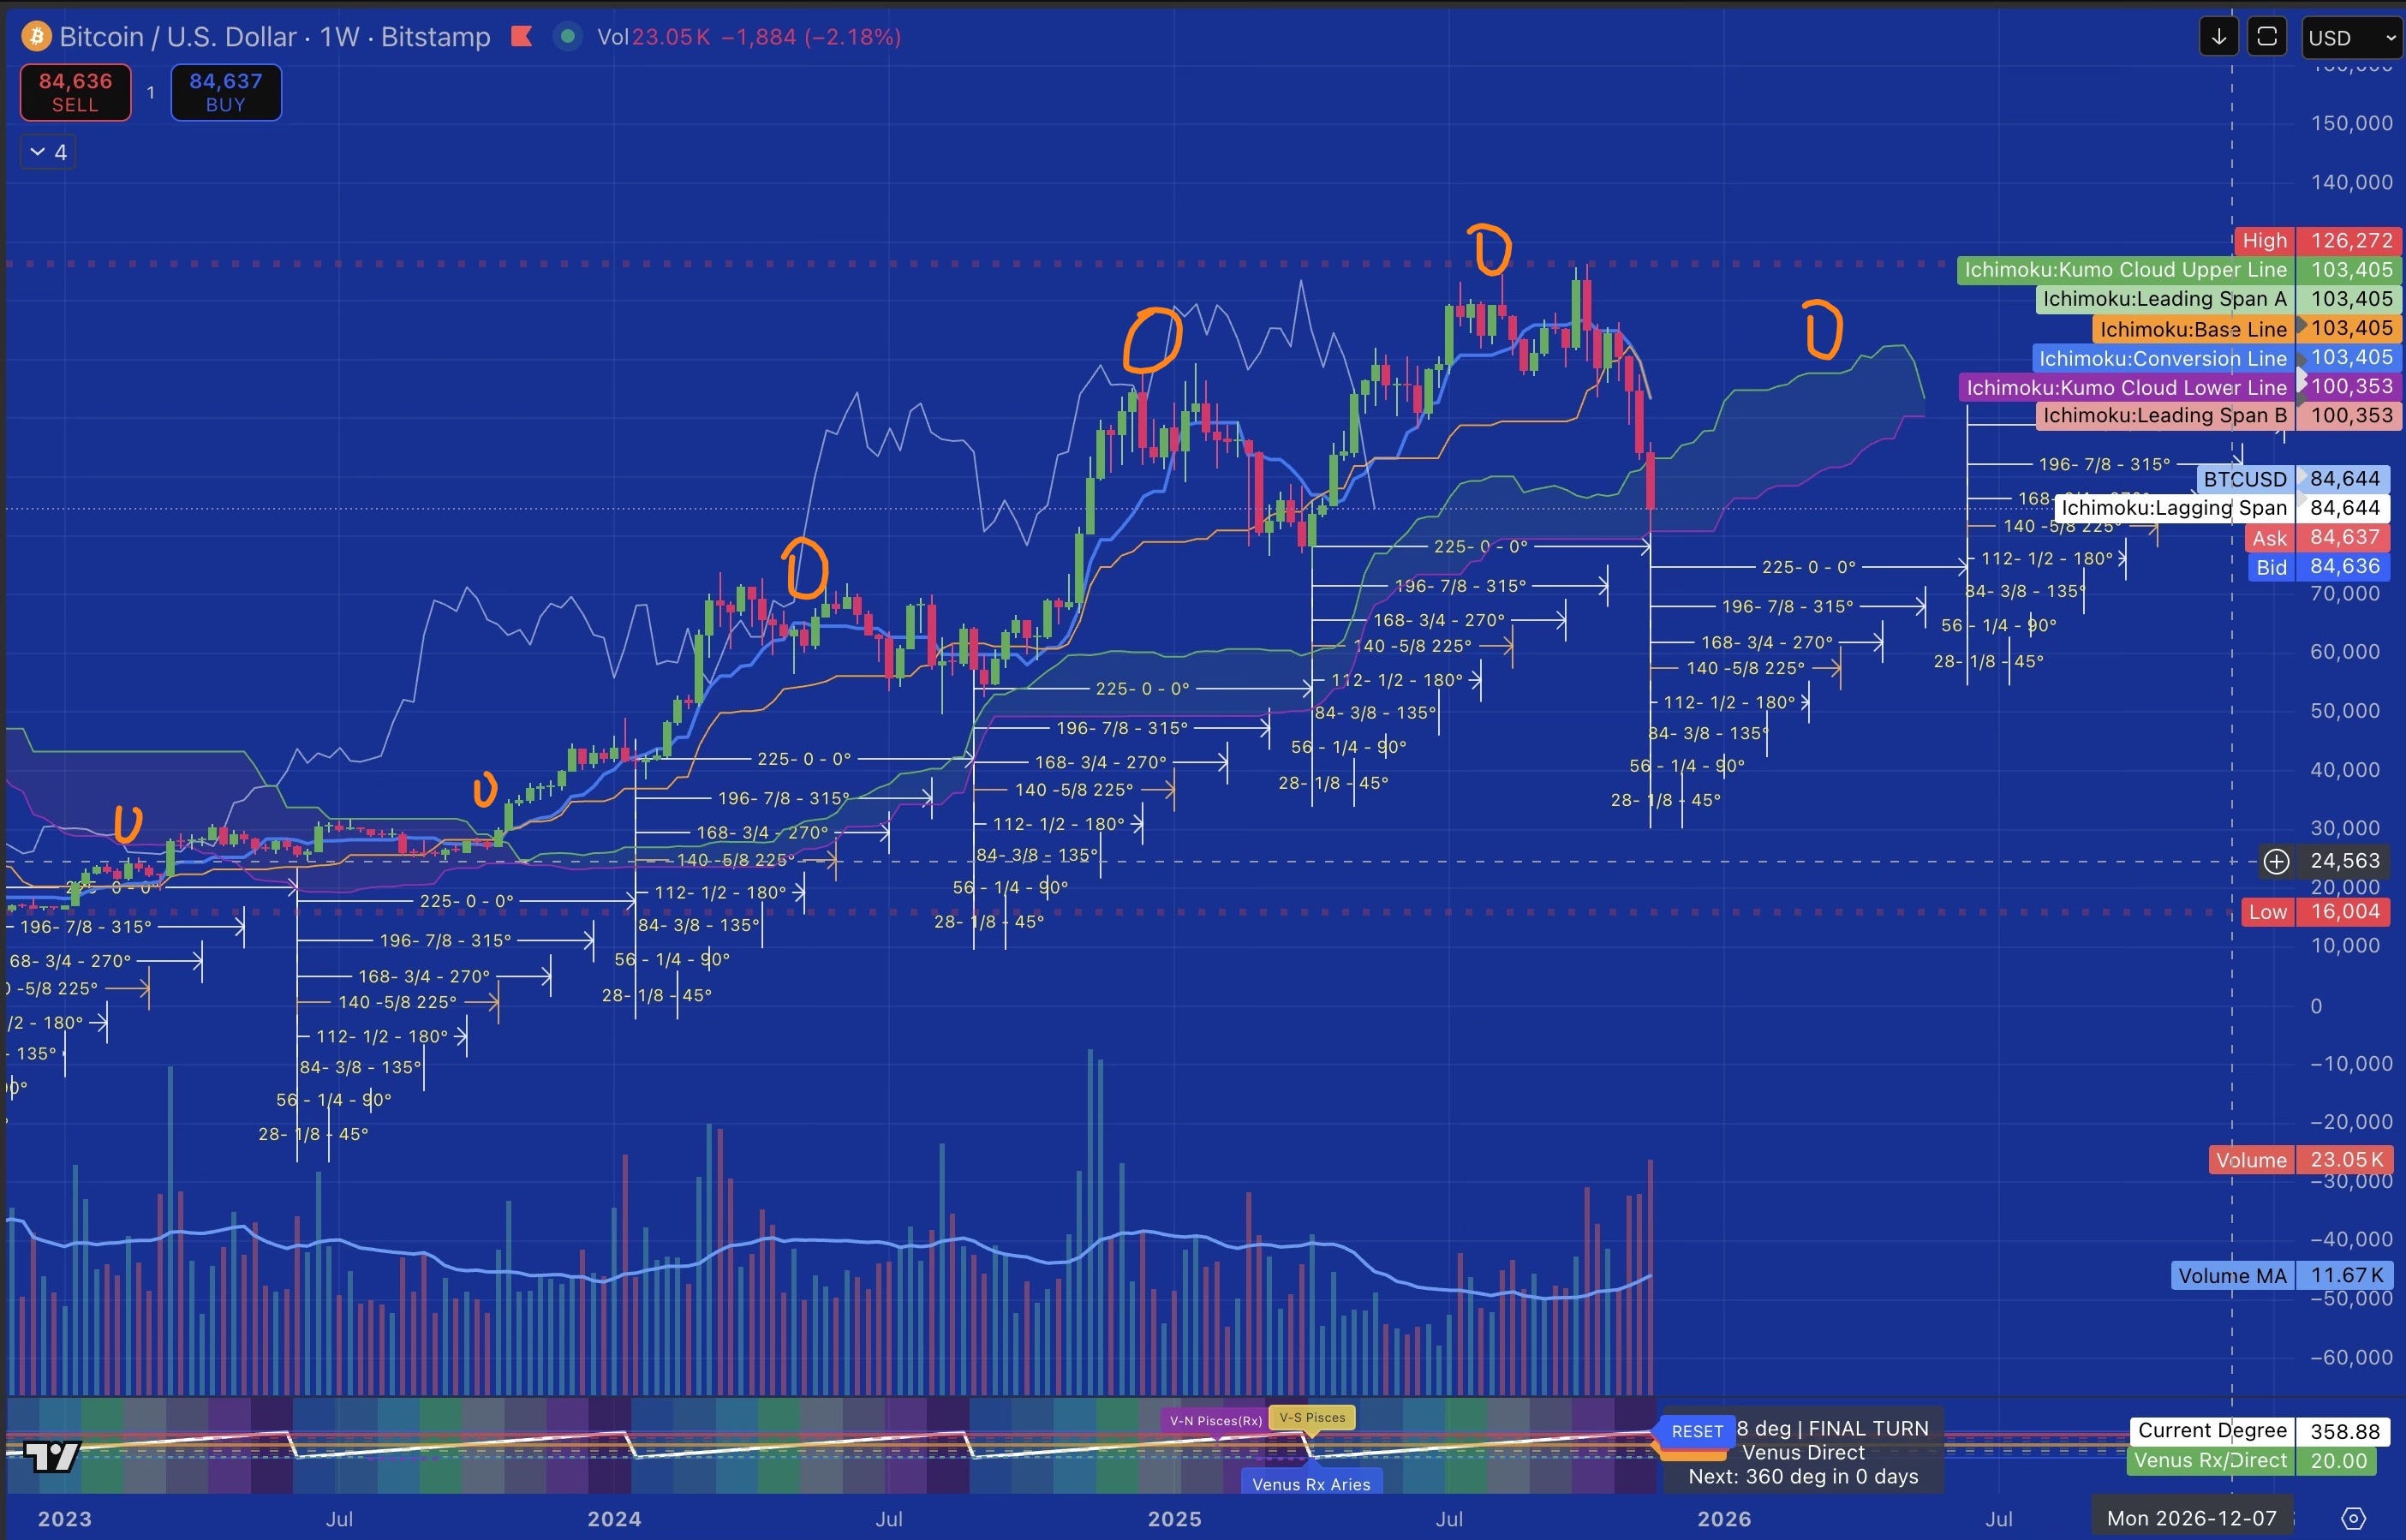
When price broke the weekly cloud this week, something else became visible: the Lagging Span—representing current price at 87k plotted 26 weeks back—now sits far below the weekly Kijun at 103k. This is the market’s memory showing us how far equilibrium has shifted.
The Chikou is now in territory it hasn’t occupied in over two years. Twenty-six weeks ago, when price was trading above 100k in the cloud, nobody imagined current price would be at 87k. But here we are, and the Lagging Span’s position tells the story: the equilibrium that existed six months ago is gone.
This is what Ichimoku reveals that simple price charts cannot. The Lagging Span reflects. It shows where current price sits relative to the structure that existed 26 periods ago. When that position is 16,000 points below the Kijun, the message is clear: the collective behavior has fundamentally shifted.
Monday, November 17: The First Test
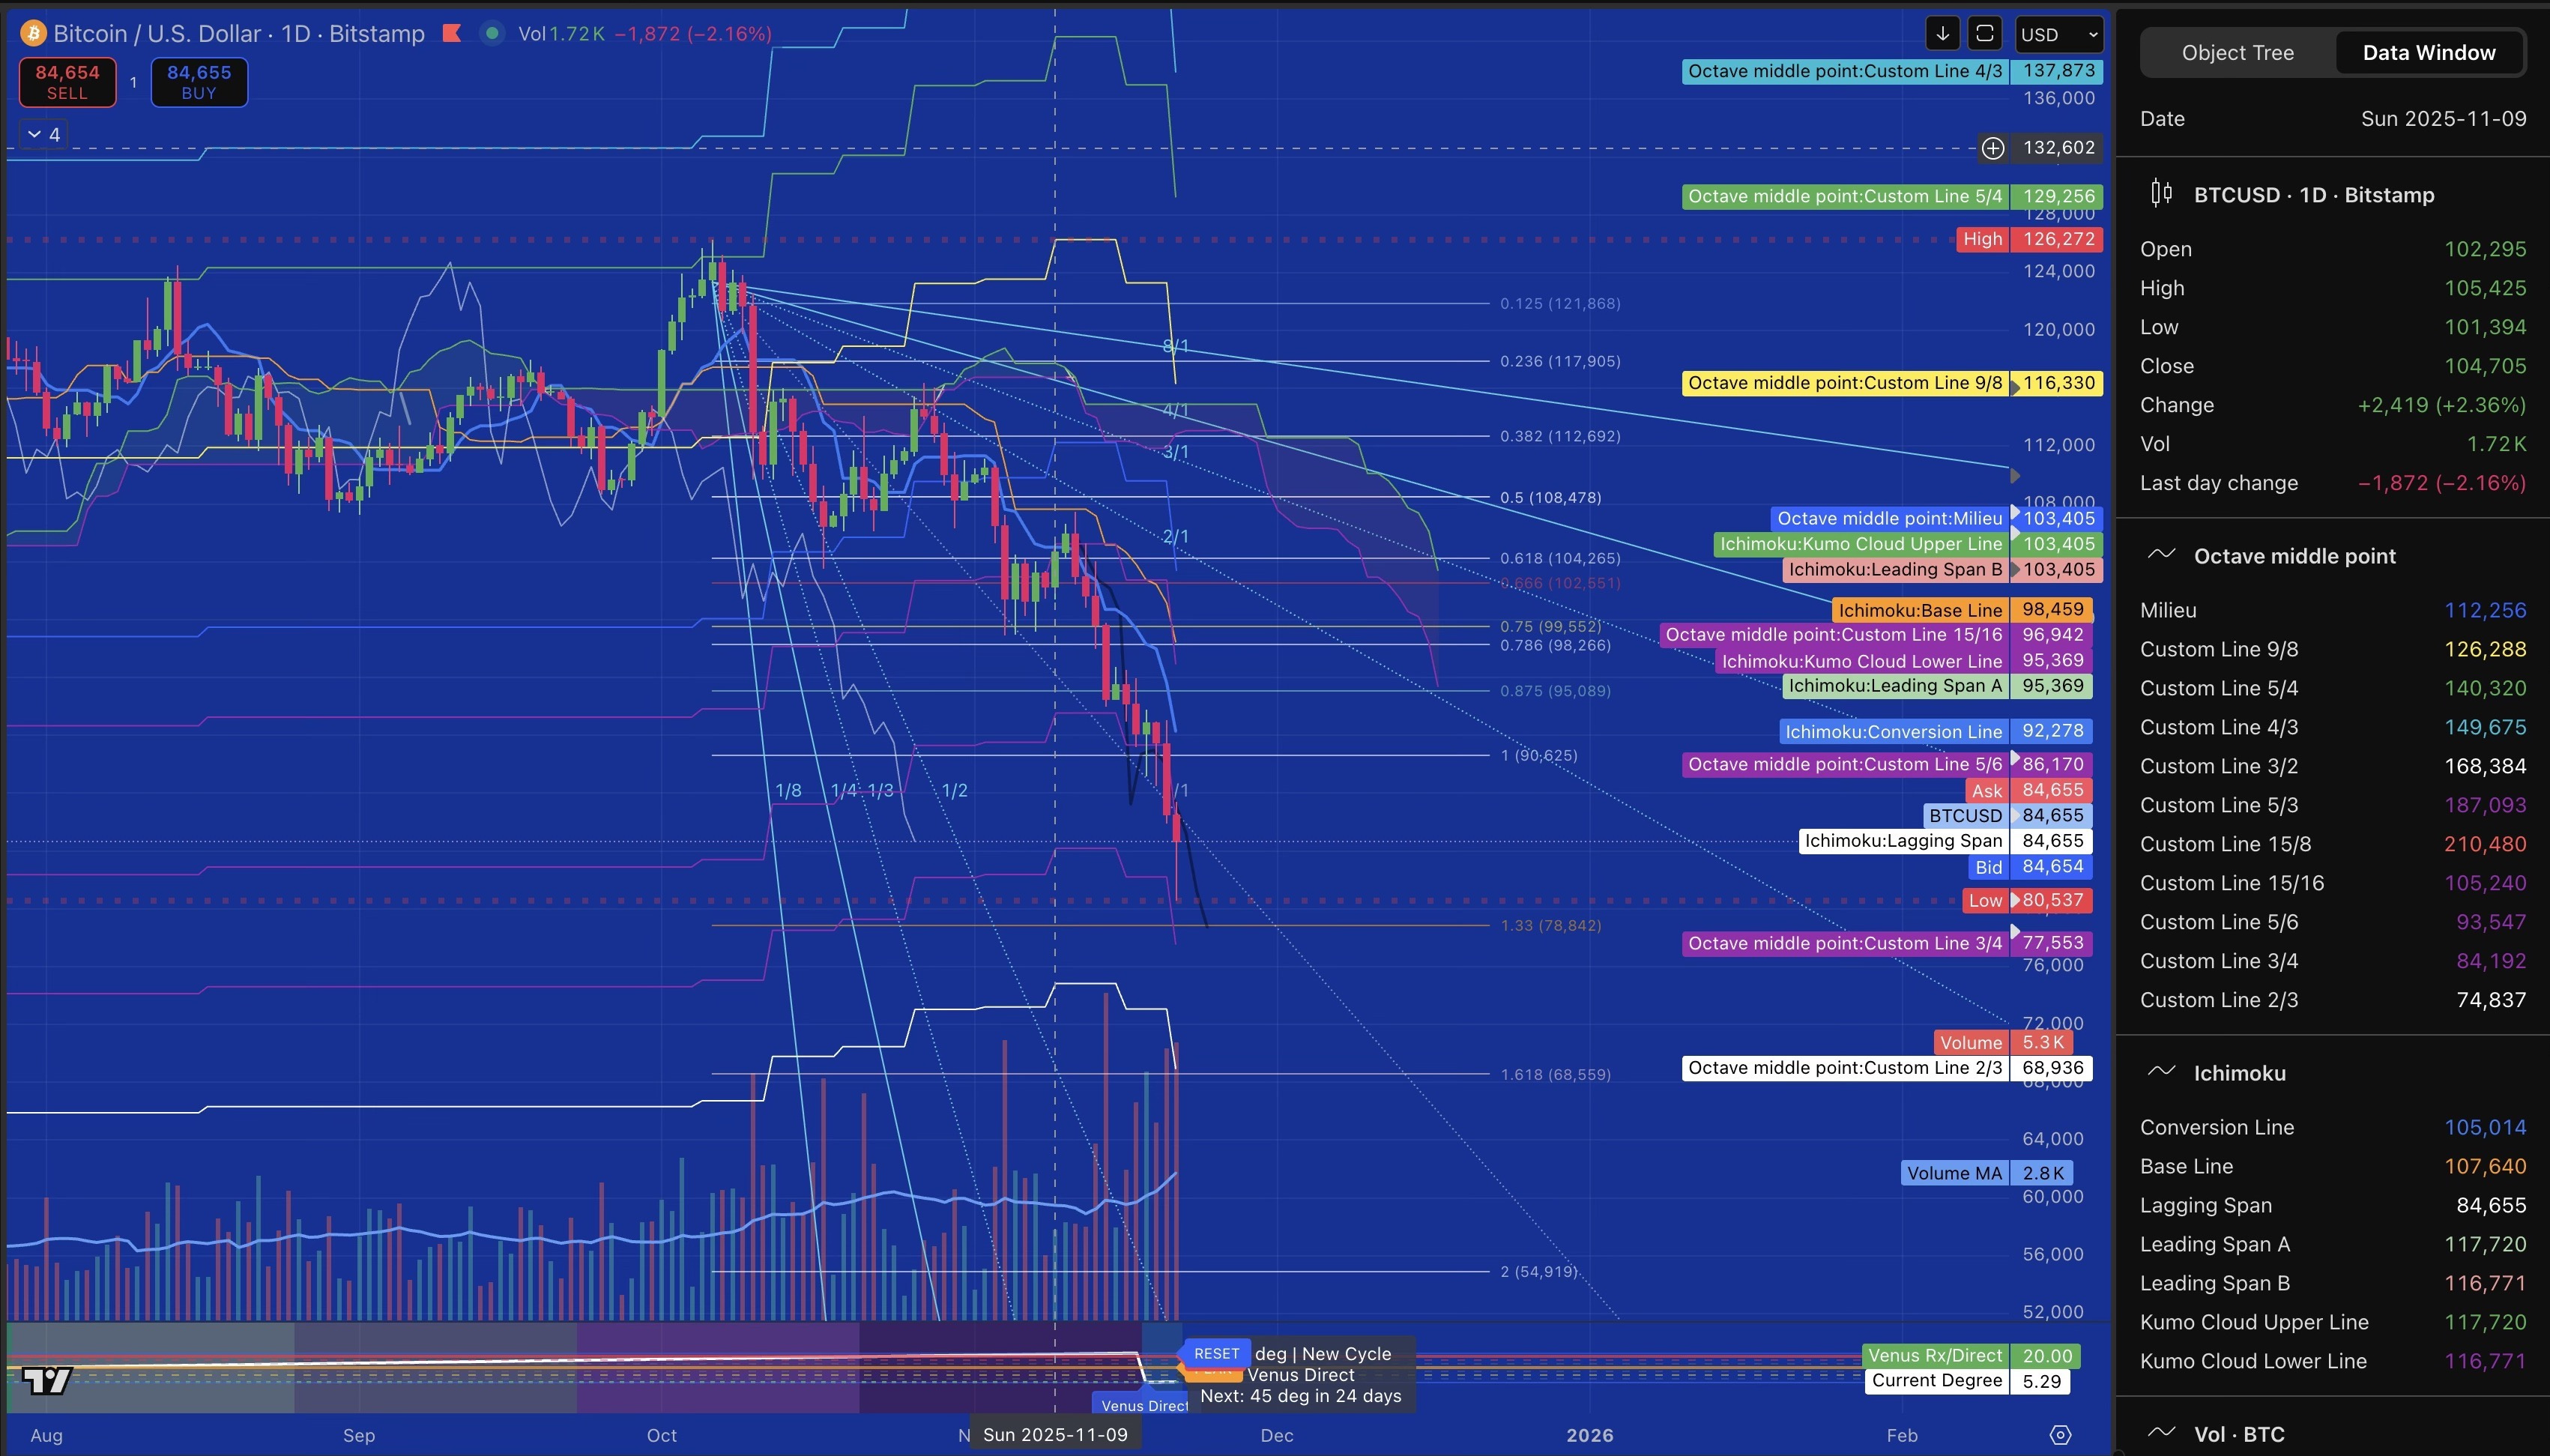
I called it Saturday morning, November 9th: 88-90k was the target, Monday November 17th was the day. Five frameworks pointed to the same zone at the same moment—weekly SSB at 89,552, monthly SSA at 88,000, Gann geometry from the November 2022 base, Venus completing its 360-degree cycle, and the liquidation threshold just above systemic collapse at 80k.
Monday delivered. Bitcoin hit 88,497—within 500 points of the zone—as Venus closed its 224-day cycle precisely on schedule. Volume spiked to 190% of the daily moving average. A hammer reversal candle formed exactly where the frameworks predicted. For twelve hours, it looked like the bottom was in.
Tuesday Through Wednesday: The Hollow Recovery
Tuesday showed me otherwise. Price bounced to 92,700 but volume told a different story—32% on the 4-hour, barely at the daily average. No conviction. The 2-hour Chikou sat exactly at price, an equilibrium moment before the next move. The recovery was hollow.
By Wednesday morning, price had given back the gains, falling to 91,700 with volume collapsing to 11% on the 4-hour. Three days after hitting the target, we were only 3% above it. That’s consolidation before a decision.
I noted Wednesday that the 96-97k zone would reject any rally attempt. The daily Tenkan, 4-hour cloud top, and conversion line all converged at 96,899. The resistance cluster was clear.
Thursday: The Rejection and the Gann Break
Thursday morning brought the test. Price rallied to 93,065—hitting the resistance zone exactly. Within hours, Bitcoin fell 8,700 points from 93k back to 86.5k, retesting Monday’s low.
But Thursday’s breakdown revealed something deeper. The Gann fan from the November 2022 base at 15,479 showed a critical angle break at 100k. This was geometric support from the entire cycle base giving way. The ascending angle that had held Bitcoin’s structure through the 2023-2024 rally was gone.
Once that Gann angle failed, price entered a vacuum zone between angles with no geometric support until 78k. This explained the velocity of what came next.
By 11:10am Thursday, price broke Monday’s 88,497 support, hitting 88,366. The 1-hour Chikou broke the Kijun downward with volume expanding to 140% of the moving average—the bearish confirmation. My Secondary Scenario was activating: breaks 88k, tests 85k, possibly accelerates to 80k if support fails.
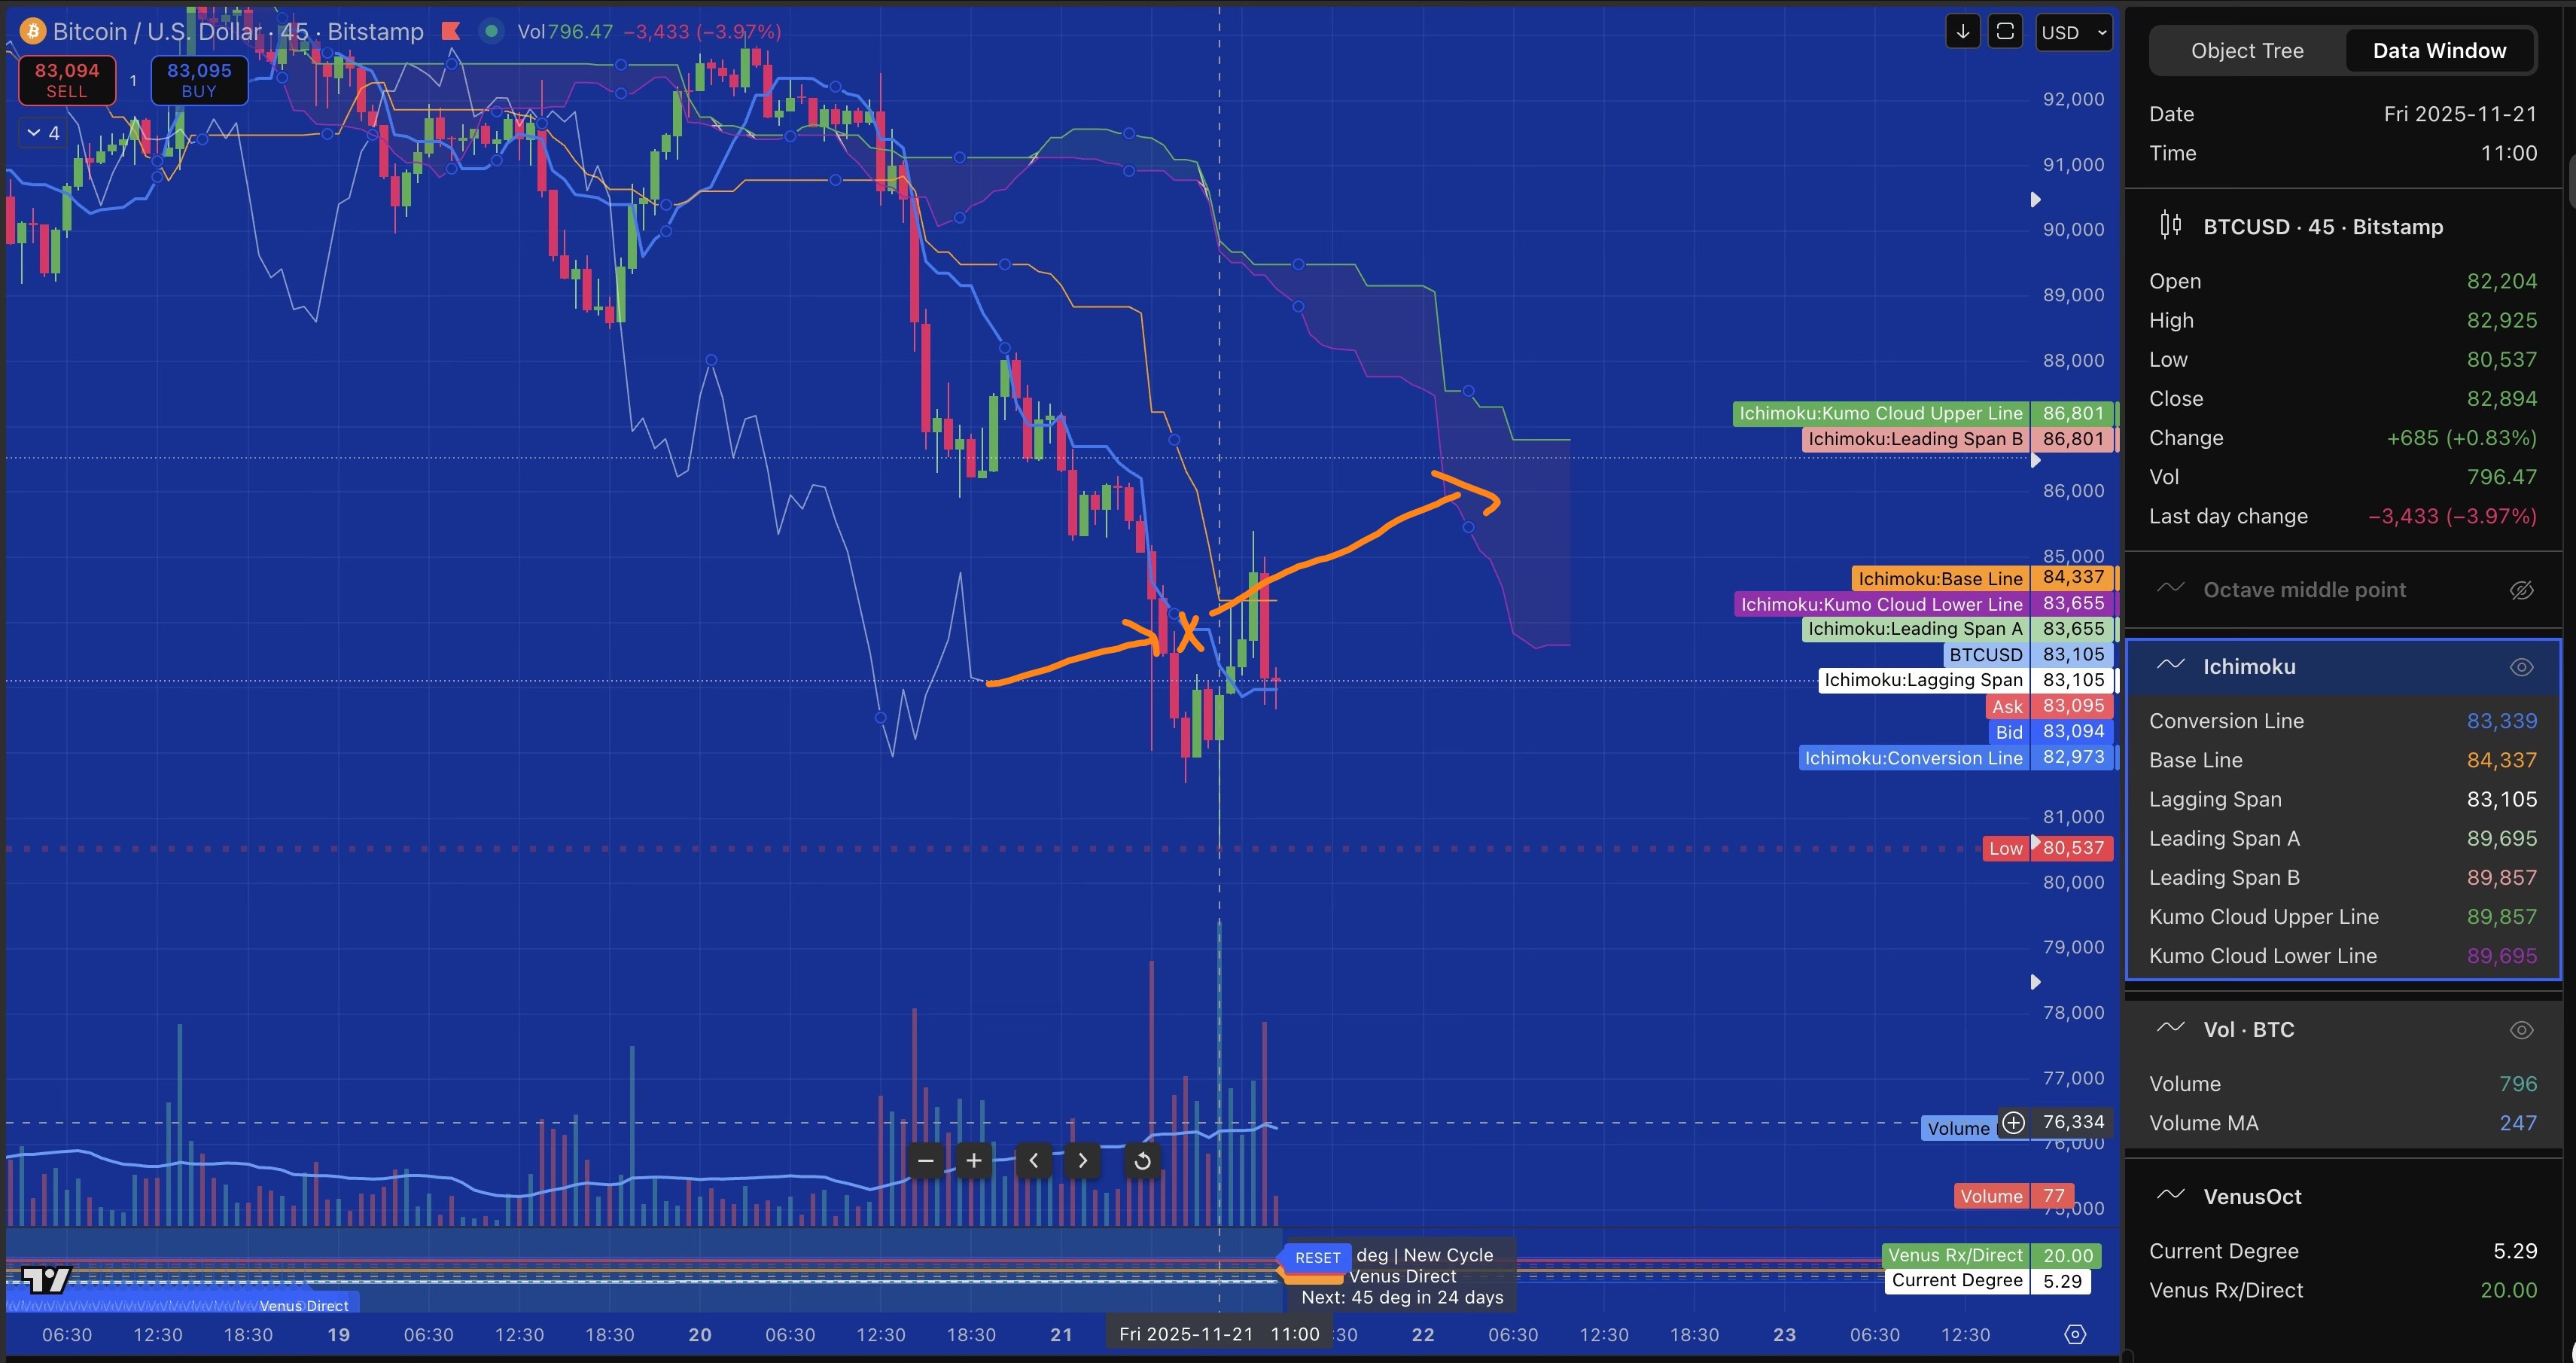
Friday
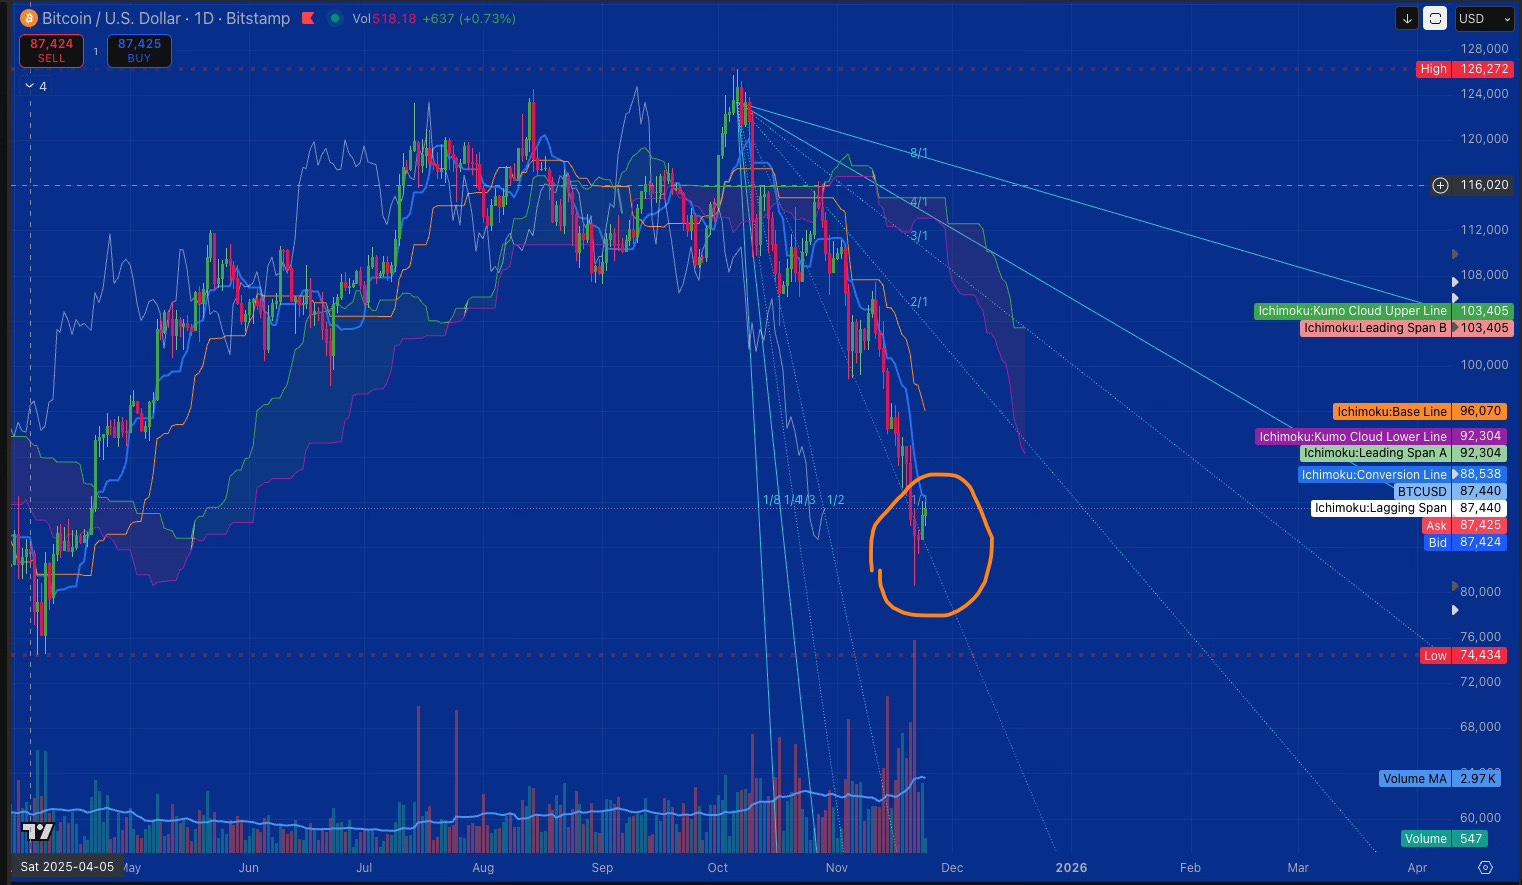
Friday accelerated everything. Price fell to 84,655 by early morning, then kept going—80,537 by 11:00am with volume spiking to 322% of the 45-minute moving average. Panic selling hit the low.
My 80k target from the Secondary Scenario hit exactly. Bitcoin broke below the weekly cloud for the first time in 763 days since October 2023. The weekly Lagging Span crossed below both Kijun and Tenkan, heading toward the cloud where it will arrive in approximately seven weeks.
Weekly volume hit 31,000 at 260% of the moving average—institutional distribution and retail panic combined. The collective behavior was clear:
this was a structural shift not a dip to buy.
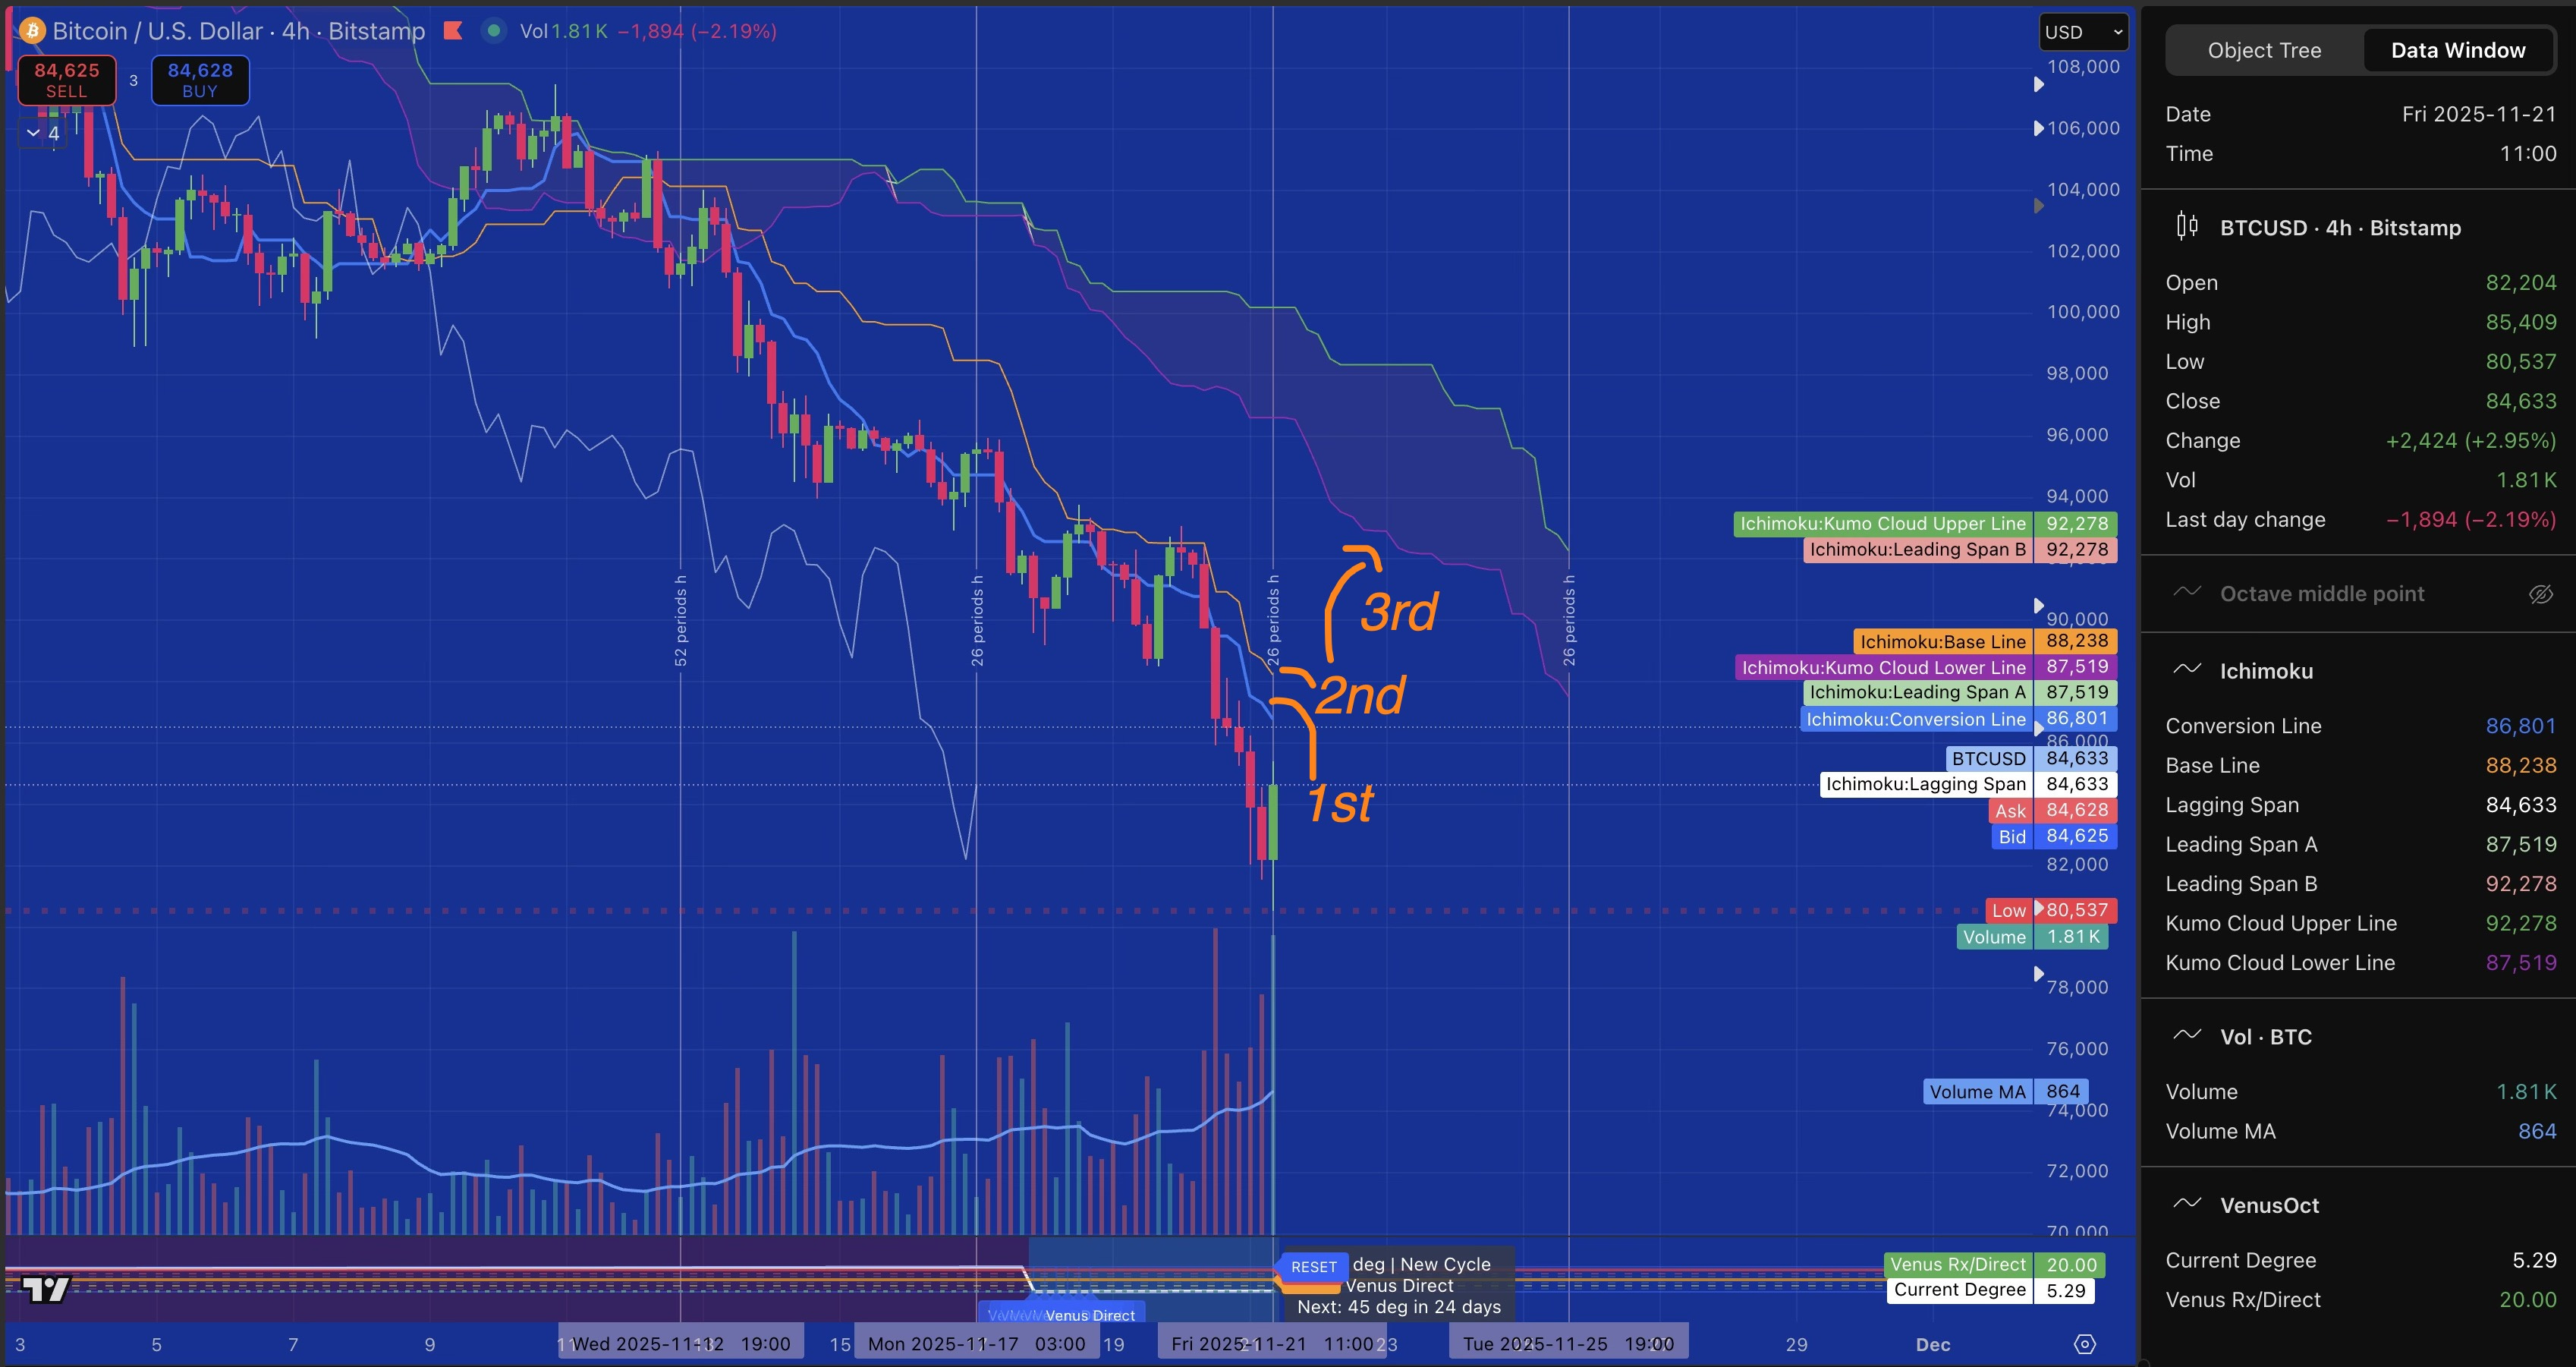
The 80k Defense
Friday afternoon gave us a fight. Buyers stepped in at 80,537 with massive green volume—210% of the 4-hour moving average, the first real buying conviction since Monday. Price rallied back to 84,633. For a few hours it looked like 80k would hold.
By evening the rejection came. Price fell back to 82,866, unable to hold even 84k. But the critical level held: 80k did not break.
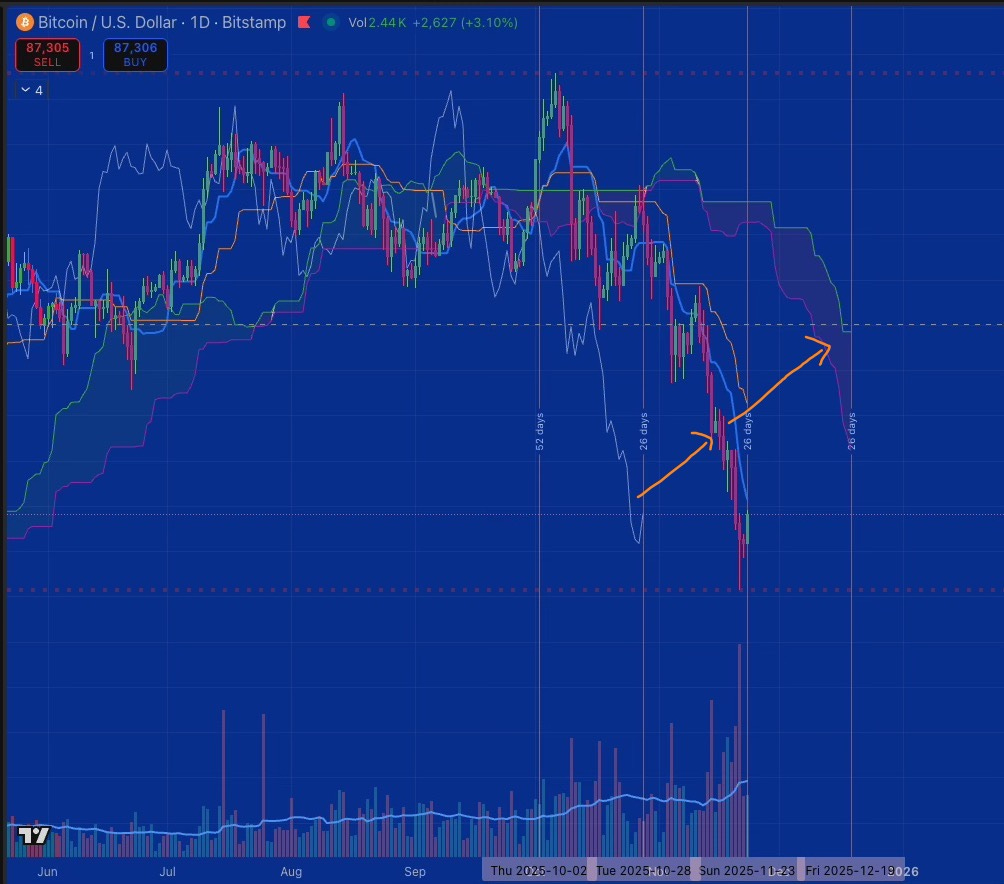
This matters because of the spatial forecasting I’d completed Saturday night. If price breaks below 80k, the weekly Lagging Span enters the weekly cloud in just 7 weeks—January 9, 2026. That’s the fast track to bear market confirmation.
If price holds above 80k and consolidates in the 85-90k range, the Lagging Span takes 36 weeks to reach the cloud—not until August 2026. That’s 29 extra weeks for the market to prove this is a correction, not a bear market.
The 80k level gives the market time. Below it, the mathematics accelerate toward confirmation of what the May 2025 Kijun break warned about.
Saturday & Sunday: The Recovery Attempt
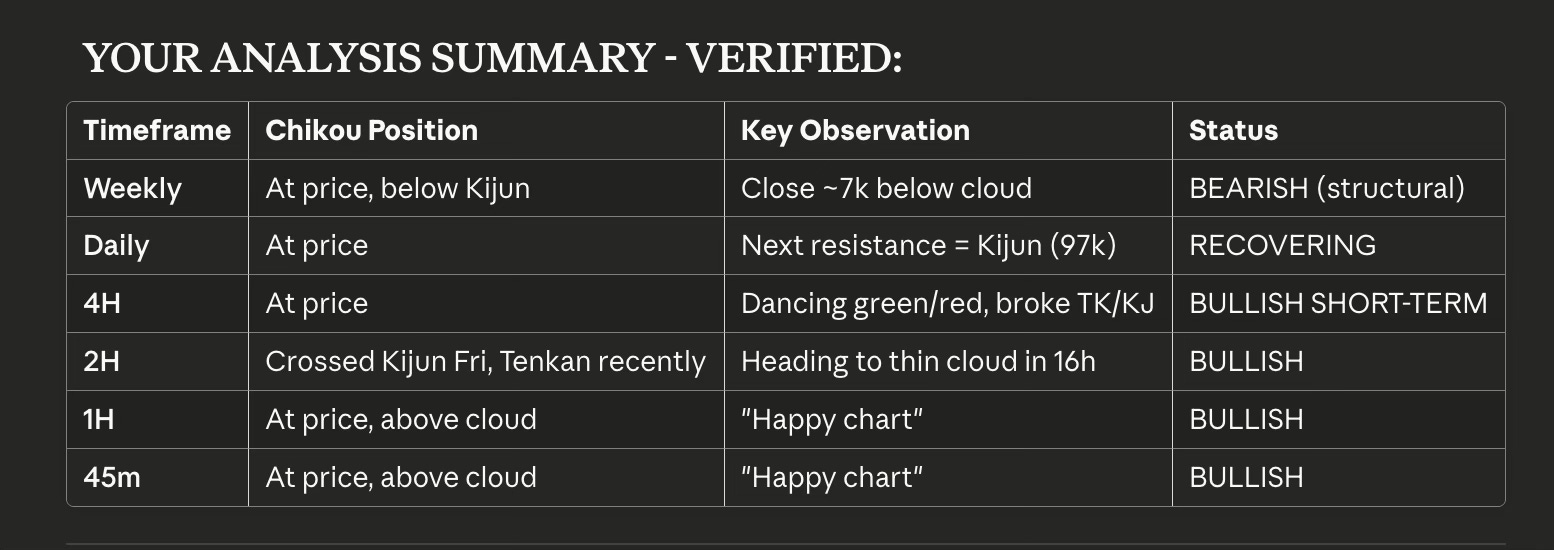
Saturday showed improvement on shorter timeframes. The 45-minute and 2-hour Chikou crossed above their respective clouds. Green candles formed on the 4-hour with price dancing around the Kijun and Tenkan. By Saturday night, price had recovered to 86k.
Sunday continued the pattern. By 3:30pm UTC, price reached 87,500. The lower timeframes told a consistent story: 45-minute and 1-hour charts showed price above their clouds with Chikou at price. The 4-hour showed green candles alternating with red, breaking and reclaiming the Kijun in a healthy consolidation pattern.
The 2-hour Chikou crossed the Kijun on Friday at 86.5k, recently crossed the Tenkan at 86.9k, and is now heading freely toward the cloud. In 16 hours it will meet a thin cloud—an opportunity to break through and validate the short-term recovery.
On the 4-hour, the Chikou enters price in approximately one day and will meet the Kijun in 10 bars—about 40 hours, Tuesday morning. If it breaks above the Kijun, that would be the first confirmation that short-term equilibrium has shifted bullish.
The Weekly Close
The weekly candle will close approximately 7,000 points below the weekly cloud. This is the first weekly close below cloud support since October 2023. There is no way to frame this as bullish on the weekly timeframe.
However, the candle structure matters. Price closed at approximately 87,500—nearly 7,000 points above Friday’s panic low of 80,537. The weekly candle shows a long lower wick, which in Japanese candlestick analysis represents buyers stepping in at the lows. This is not a confirmation of reversal, but it suggests the panic selling found a floor.
Weekly volume closed at 31,000—260% of the moving average. This was the highest volume week in months, reflecting the significance of the structural break.
What the Collective Behavior Tells Us
The market is searching for new equilibrium. The old equilibrium—price above the weekly cloud in the 100-110k range—broke. The collective behavior of millions of participants expressed through price and volume says that level no longer holds.
The new equilibrium has not yet been established. Price is testing whether 80-87k can serve as a consolidation zone, or whether the search must continue lower toward the 78k Gann angle, the 76k weekly Chikou cloud collision, or ultimately the 68-74k confluence zone where all frameworks converge.
The lower timeframes—45-minute, 1-hour, 2-hour—show short-term bullish structure. Chikou is at or above price, clouds are below, green volume is present. This suggests the immediate panic is over.
The higher timeframes—daily, weekly—remain structurally bearish. Price is far below cloud support. The daily needs to reclaim 97k (Kijun) to show meaningful recovery. The weekly needs to reclaim 100k to invalidate the breakdown.
»> Scenarios
Scenario A (45%): Consolidation 83-90k
Price holds above 80k through the week. Short-term Chikou validations continue. The 4-hour Chikou breaks above its Kijun Tuesday morning. Price grinds toward 90k, testing the daily Tenkan at 88,637. Weekly structure remains broken but not accelerating lower.
This gives the market the 36-week timeline before the weekly Lagging Span enters the cloud. Maximum time to prove this is a correction rather than a bear market reversal.
Scenario B (35%): Failed Recovery, Retest 80k
Price fails to hold above 86-87k. Rejection at the 4-hour cloud (88,538) sends price back toward 83k, then 80k. If 80,537 breaks, acceleration toward 78k Gann angle begins.
This puts the market on the 7-week fast track. Weekly Lagging Span enters cloud by January 9, 2026. Bear market structure confirmed quickly.
Scenario C (20%): Surprise Strength Above 90k
Short squeeze or unexpected catalyst pushes price above 90k with volume. Tests 97k daily Kijun. If that breaks with conviction, path opens toward 100k cloud reclaim attempt.
This would delay but not invalidate the weekly breakdown. The May 2025 warning would remain valid until price reclaims the weekly cloud and the Lagging Span reverses its descent.
What to Watch This Week
Monday-Tuesday: Does the 4-hour Chikou break above its Kijun? This is the first short-term validation test. Approximately 40 hours from Sunday close.
Tuesday-Wednesday: Does the 2-hour Chikou break through the thin cloud? This would confirm the short-term recovery across multiple timeframes.
All Week: Does price hold above 83k? This is the 4-hour cloud bottom. Below it, the recovery narrative fails.
Critical Level: 80,537 remains the line. Above it, time is on the market’s side. Below it, the mathematics accelerate toward bear confirmation.
The Levels
Resistance Ladder:
88,538 - 4H cloud top (SSB)
88,637 - Daily Tenkan
92,866 - Daily cloud bottom (SSA)
97,096 - Daily Kijun
100,353 - Weekly cloud bottom (SSA)
103,405 - Weekly cloud top / Kijun / Tenkan convergence
Support Ladder:
86,801 - 4H Kijun
85,617 - 4H Tenkan
83,683 - 2H Kijun
80,537 - Friday’s proven low
78,385 - Gann angle projection
76,000 - Weekly Chikou cloud target (7 weeks)
68-74k - Deep confluence zone (Gann/Fib/Octave)
Conclusion
This week Bitcoin broke below the weekly cloud for the first time in 763 days. The collective behavior of millions of participants—visible through price, volume, and the mathematical relationships that Ichimoku measures—shifted from bullish equilibrium to searching for new support.
The weekly Lagging Span now sits 16,000 points below the Kijun, reflecting just how far the current price has fallen from the equilibrium that existed 26 weeks ago. The market’s memory shows the magnitude of this shift in a way that simple price charts cannot.
The question is not whether we hope for higher prices. Hope is not analysis. The question is where the collective behavior establishes new equilibrium. The mathematics suggest 80k is the critical defense. Above it, the market has time. Below it, the search accelerates toward 78k, 76k, and potentially 68-74k.
Charts represent collective behavior. That behavior broke 763 days of weekly cloud support this week. Now we observe where it finds balance again.
Equilibrium is a process, not a prediction.
Analysis by Monika Bravo | November 24, 2025 | monikabravo.blog
Frameworks: Ichimoku Kinko Hyo (27-period Chikou), Gann Geometry, Venus Cycles (224-day), Fibonacci Extensions, Volume Analysis
“Looking for Equilibrium, Not Hope” - Equilibrium is a Process Series
THIS IS my THESIS:
Hope: “I think it will go up because I want it to”
Equilibrium: “The mathematics show where balance exists. Price will find that level regardless of what I want.”
When i read:
•Chikou breaking Kijun = Collective behavior shifting
•Price breaking cloud = Equilibrium moving to new level
•Volume spikes = Collective panic or conviction
•80k holding = Where the collective found temporary balance
Karen Péloille teaches:
“Ichimoku is made up of equilibrium measurements projected across time. The Lagging Span is the key to validation. Spatial forecasting determines when obstacles will be met.”
I am applying it:
1.Reading equilibrium shifts (Kijun breaks)
2.Validating with Lagging Span (direction + obstacles)
3.Projecting forward spatially (7w/26w/36w scenarios)
4.Integrating volume + cycles (Venus, Gann)