The Geometry of a Decline: Mapping the 88k Equilibrium Zone
A Spatial and Harmonic Analysis of Bitcoin’s Return to the Core Level

BITCOIN TECHNICAL ANALYSIS SUMMARY
Week of November 9-15, 2025 A Real-Time Validation of Equilibrium Analysis
SUMMARY
Bitcoin fell from 106k to 95.5k in five days, validating my Saturday morning forecast. I called Path B—consolidation followed by decline to deeper supports—and watched every level break in sequence. On Monday, I read the Chikou Span would collide with price at 105k in exactly two days. Tuesday morning it happened. Price went sideways for hours, then broke down Wednesday with massive red candles through 102k, then 100k where my Gann angle from the November 2022 low finally gave way. Thursday I said 96k was next. By Friday morning we hit 95,484—my lowest target of the week. Now we’re consolidating at 95.6k with volume running at 18-32% of the moving average across every timeframe I’m watching. No panic, no conviction, just waiting.
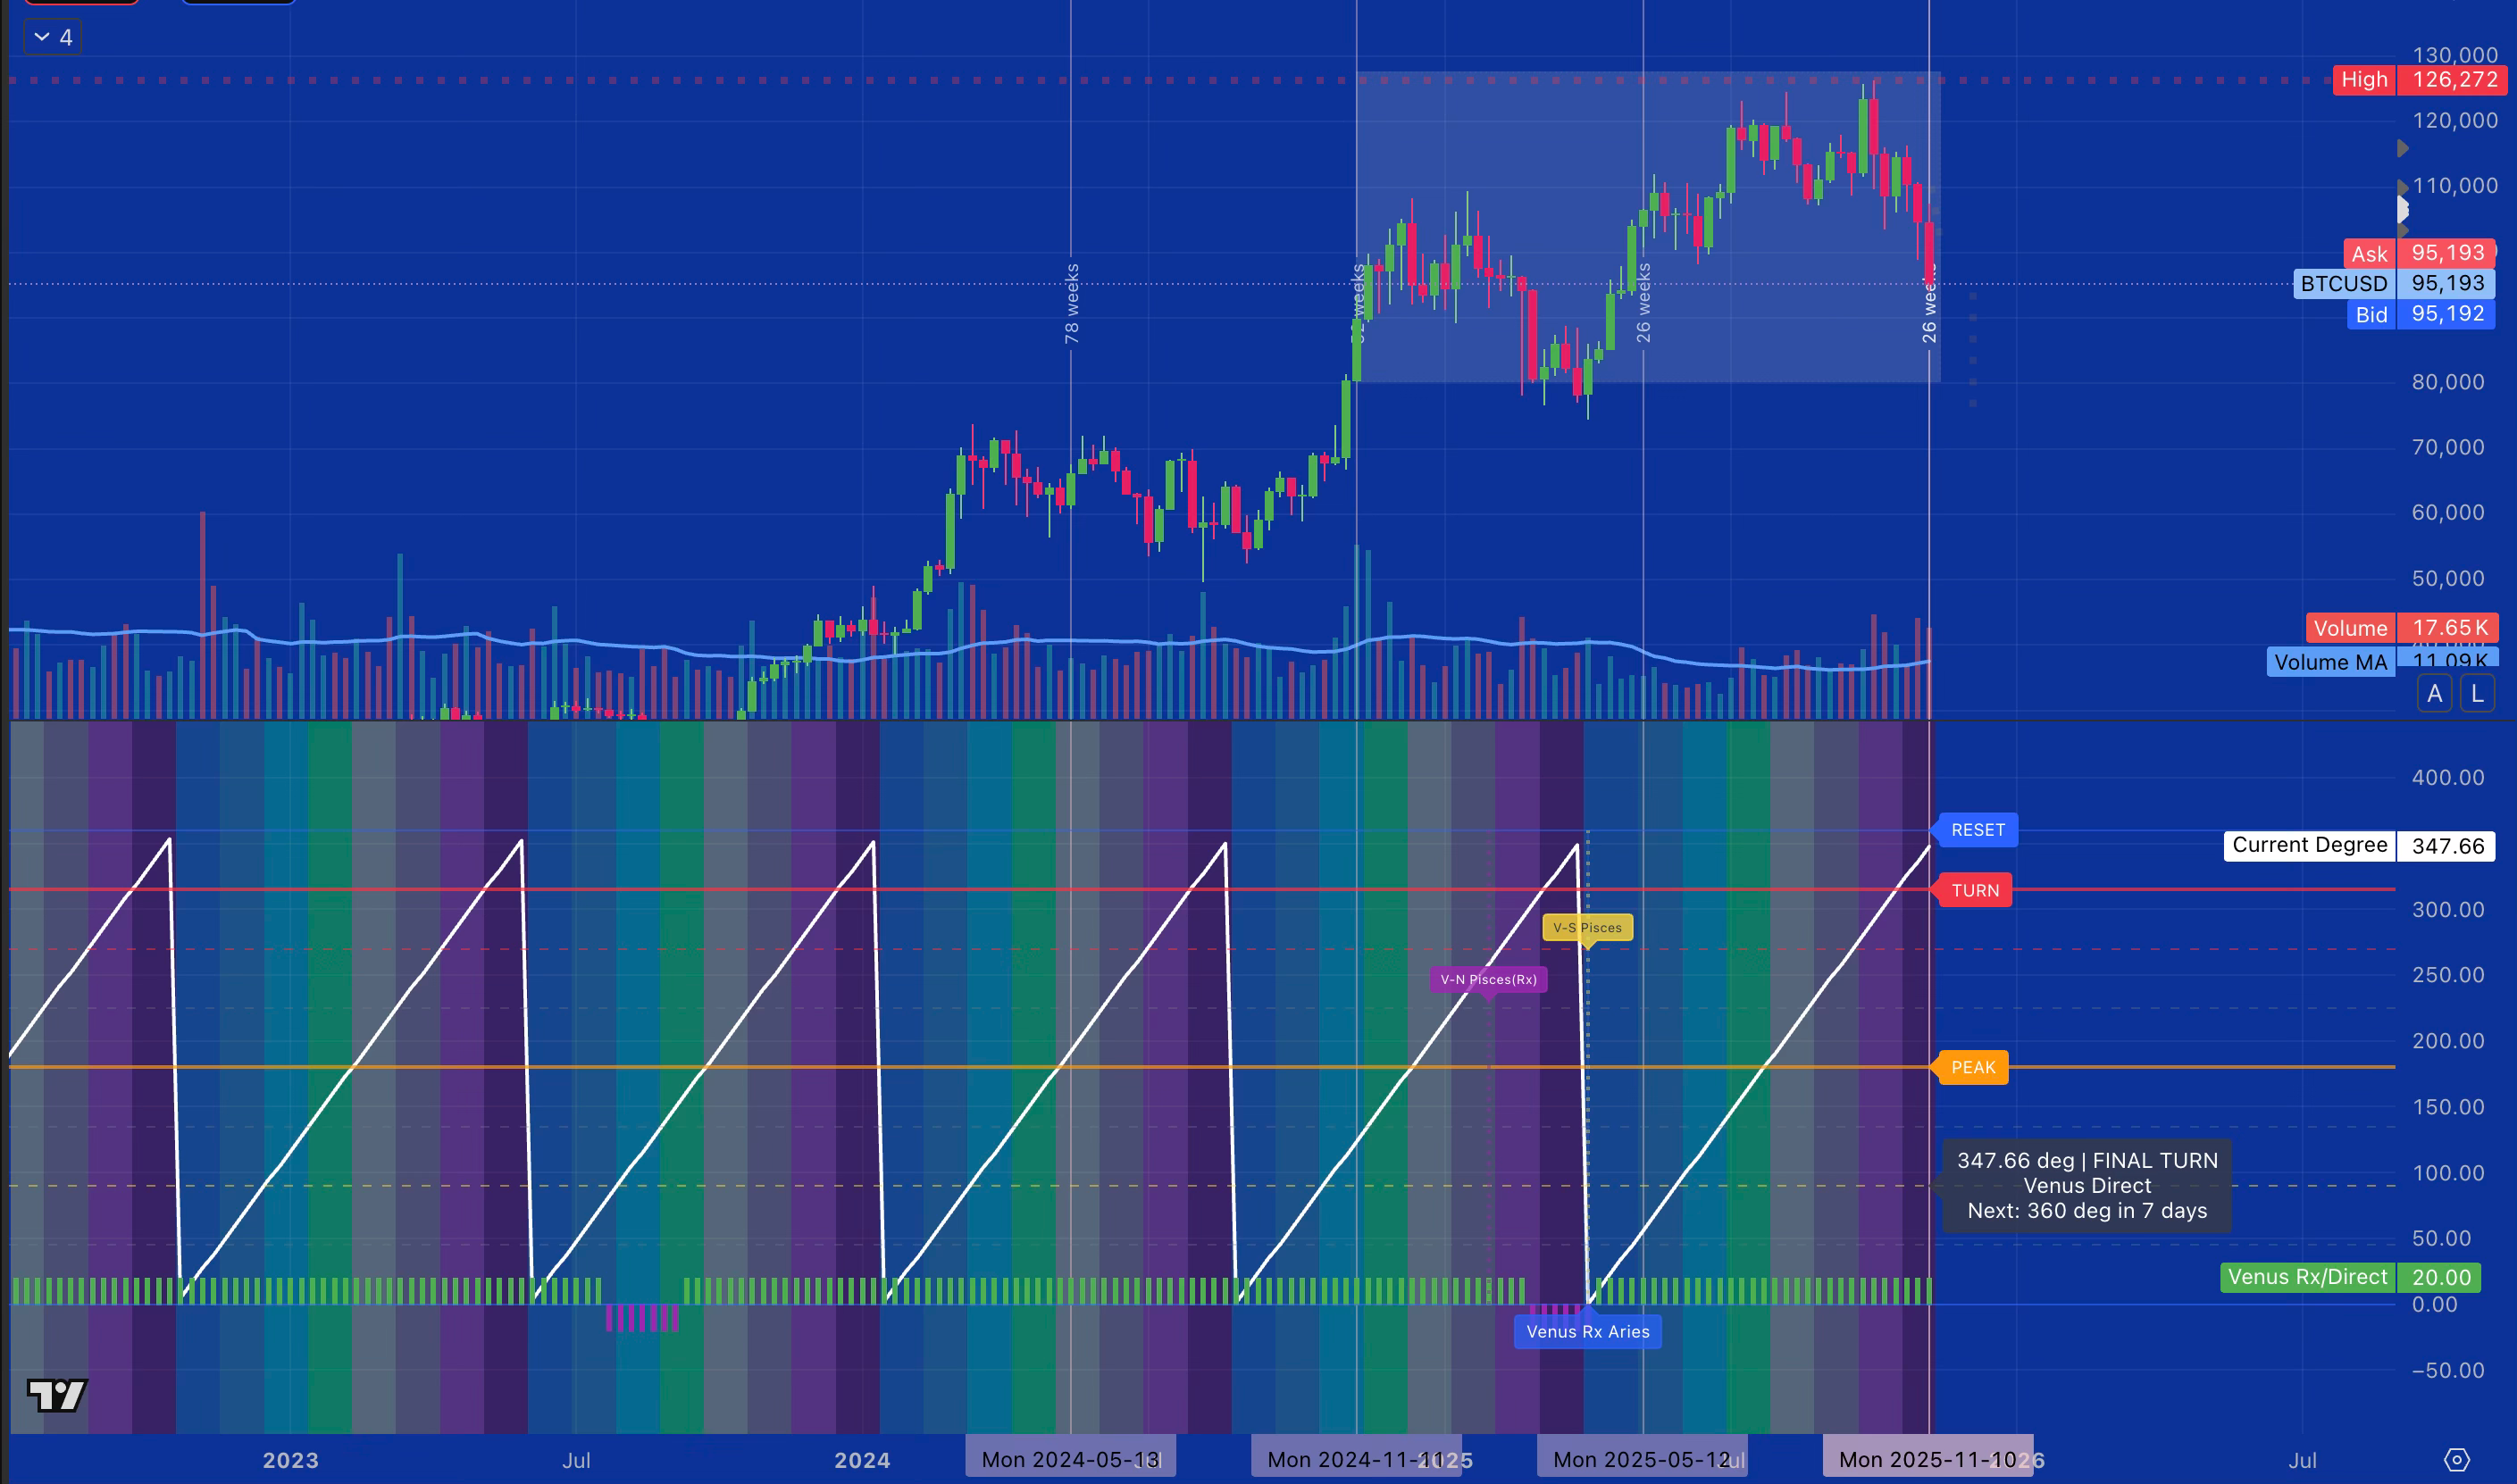
Monday is Venus cycle completion day. After 224 days the planetary rhythm closes at 360 degrees, and historically these closures mark major Bitcoin inflections. But that’s just one piece.
What makes Monday critical is that five completely different ways of measuring market structure all point to the same zone: 88-90k.
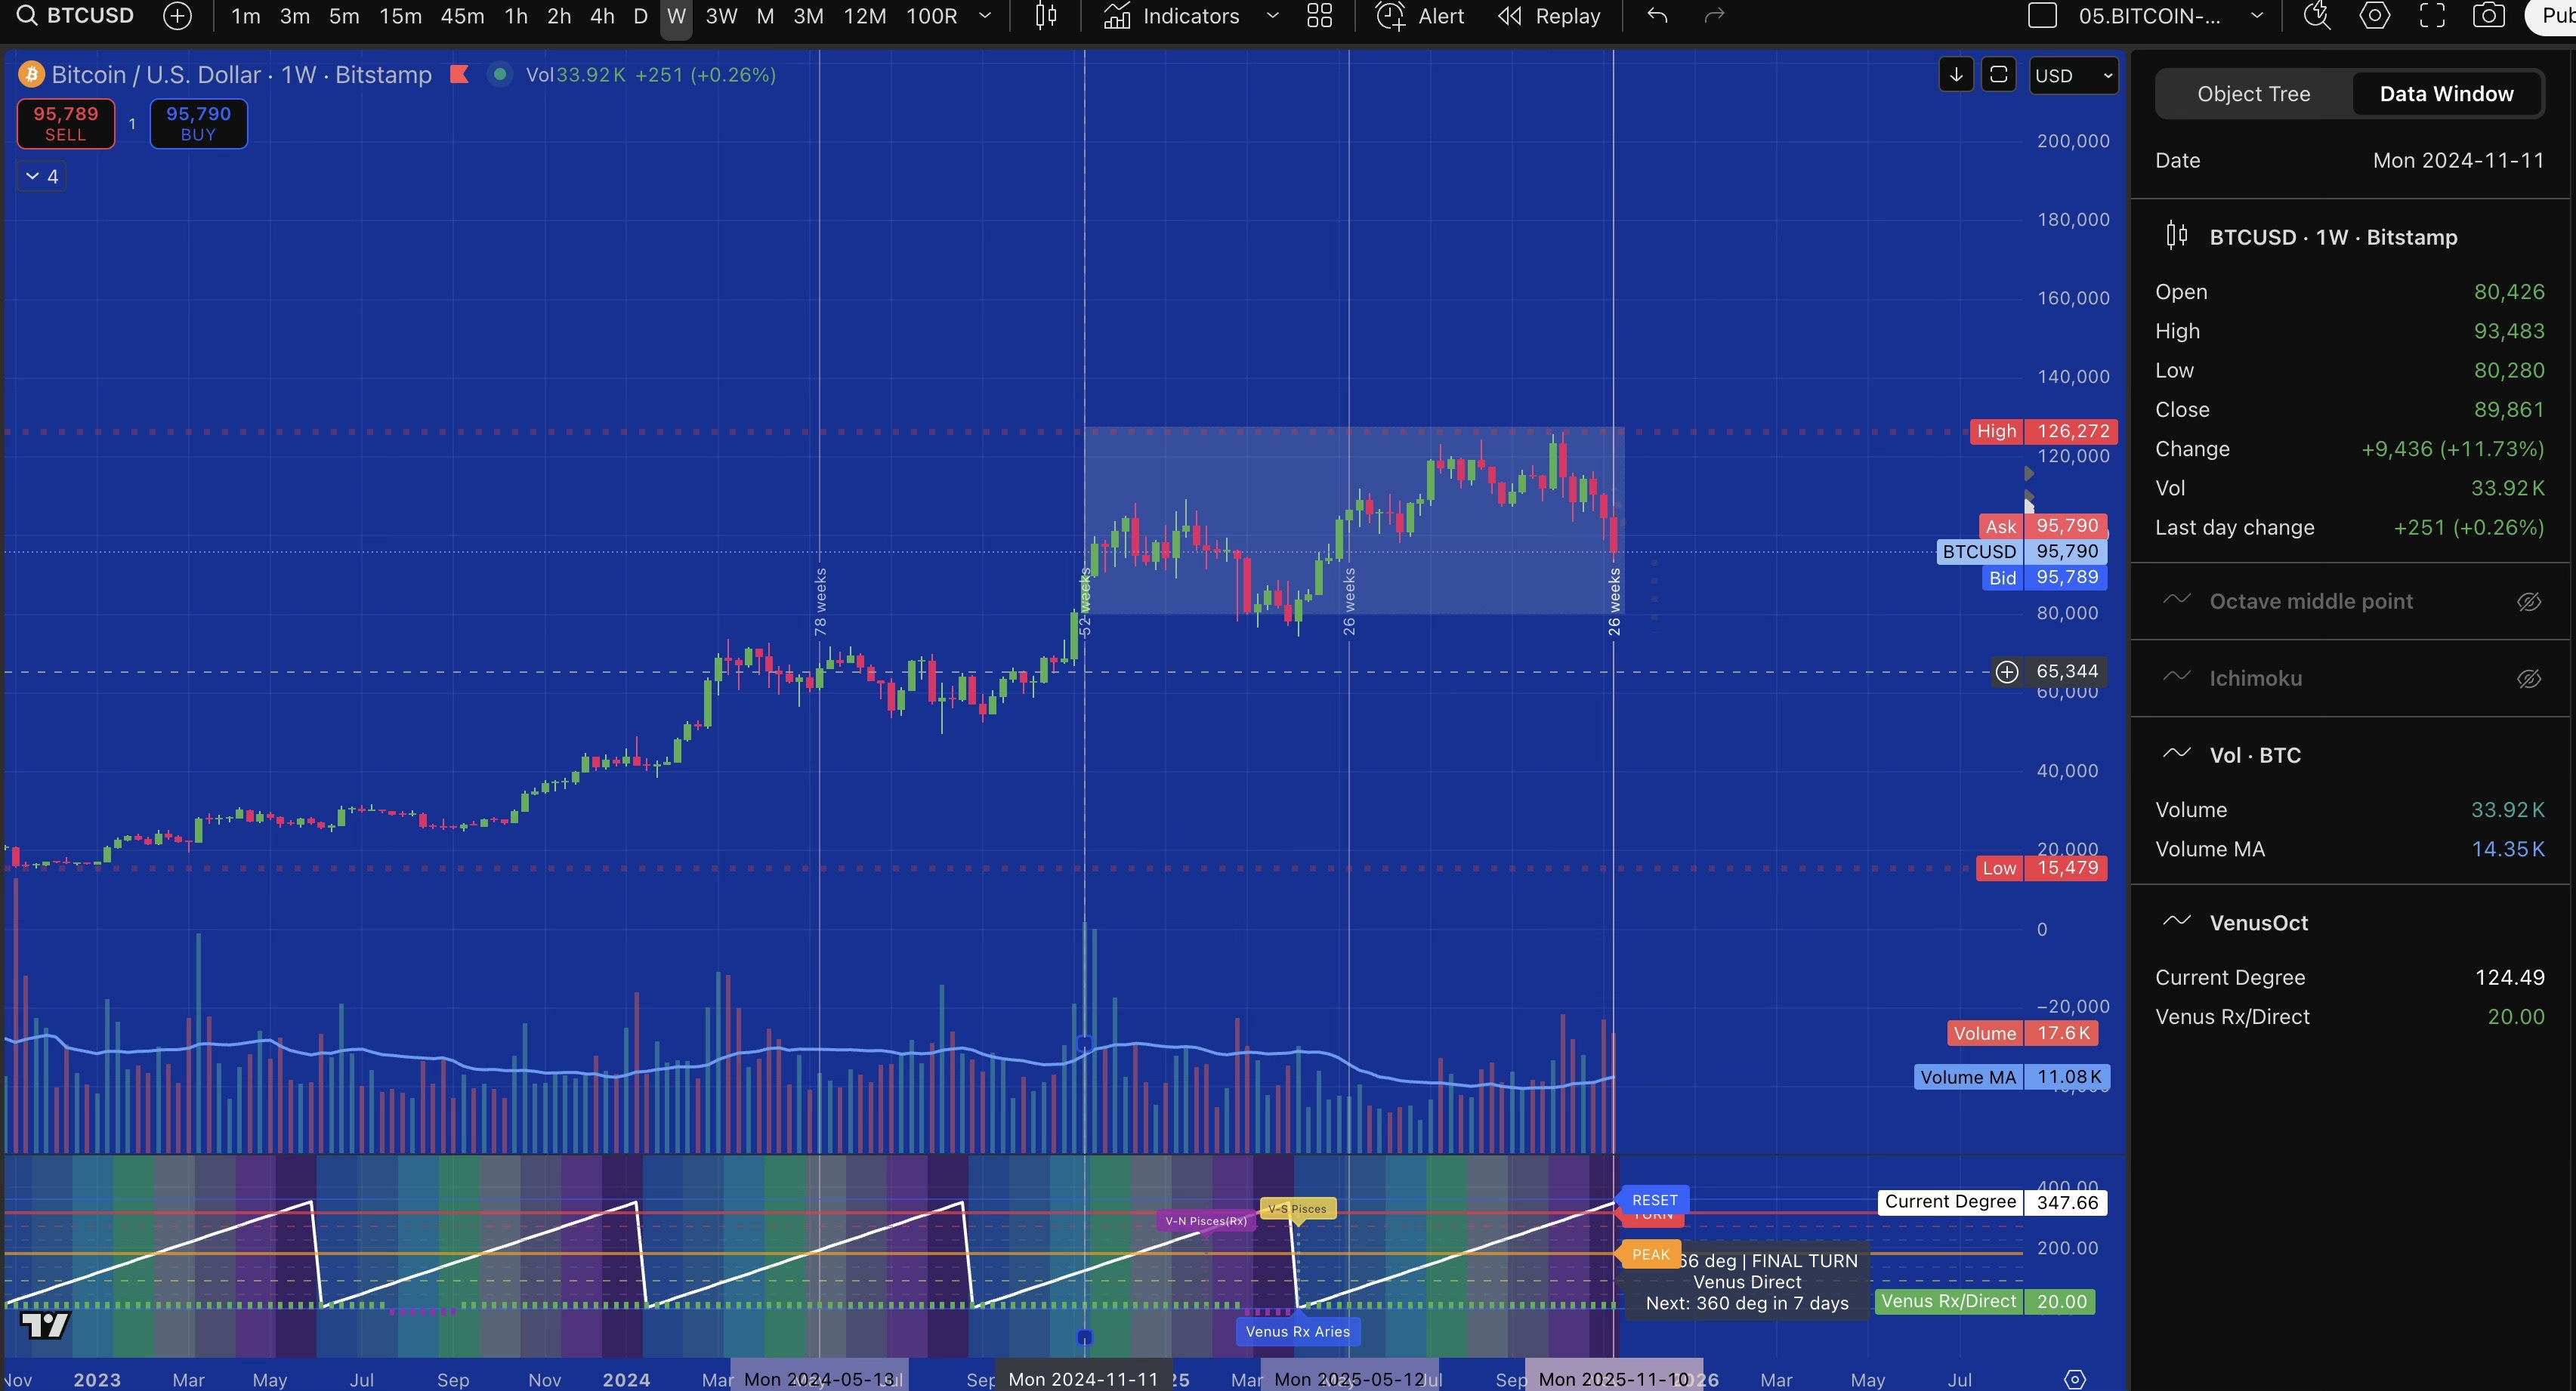
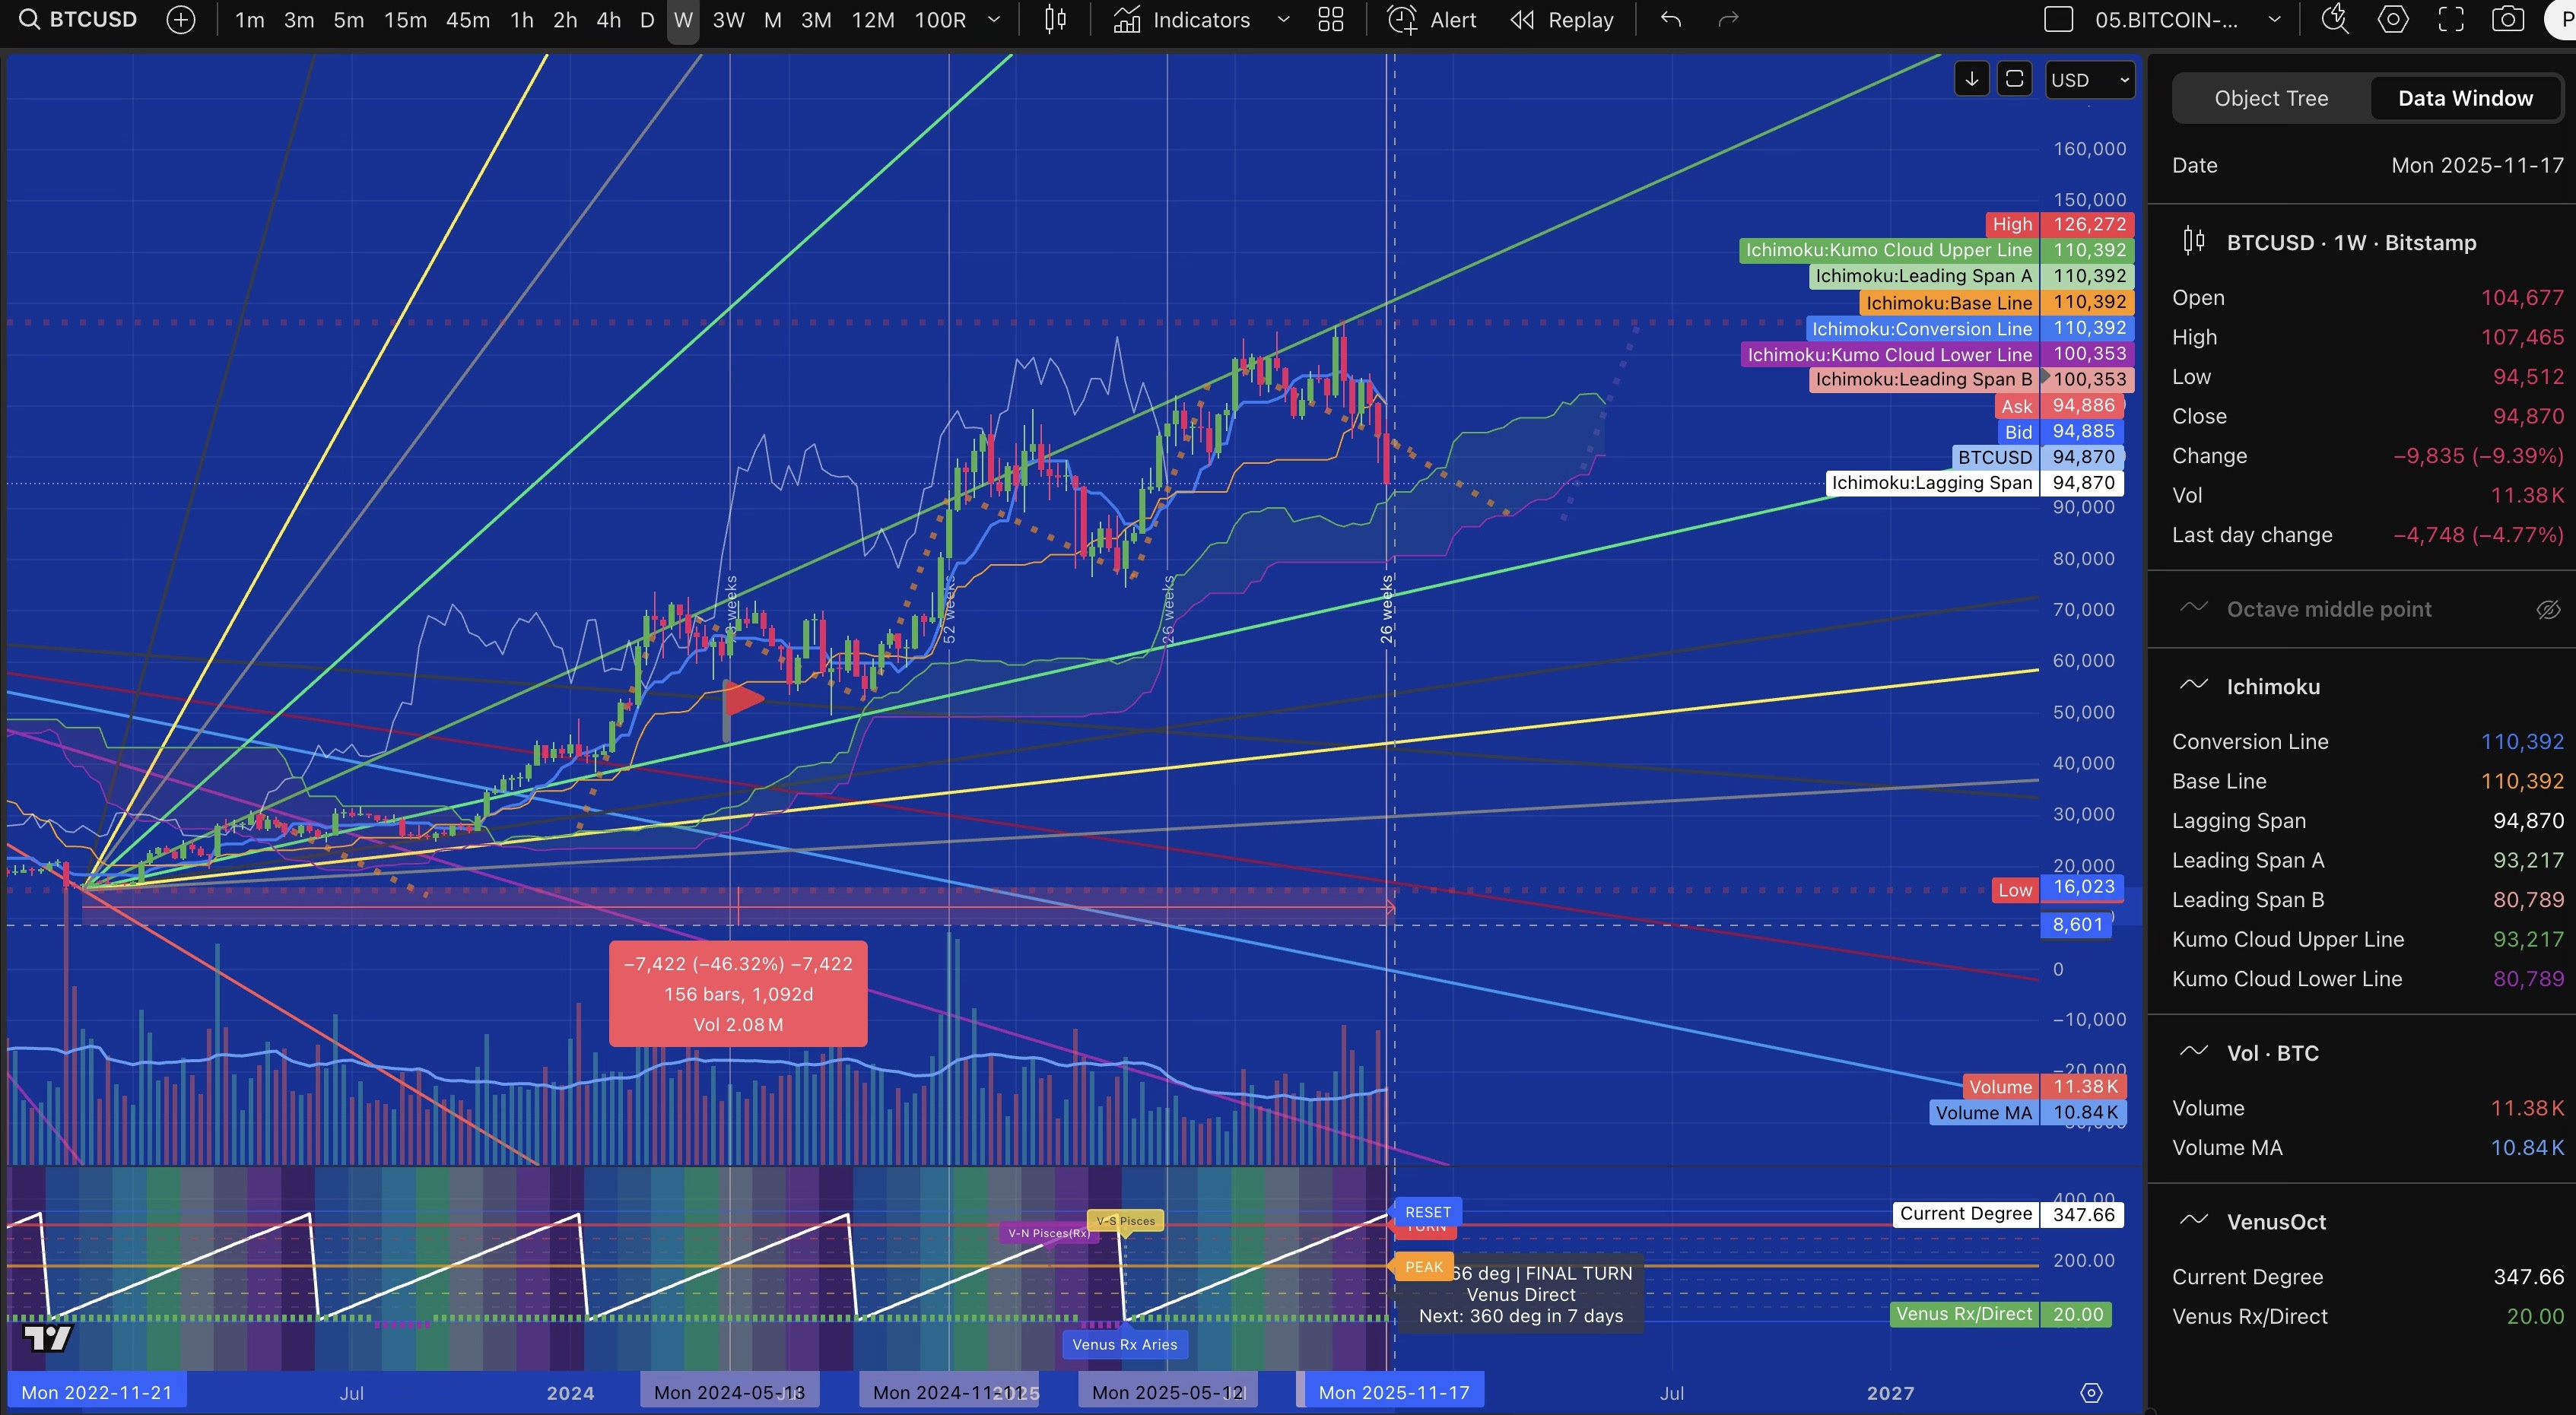
The weekly Senkou Span B—the cloud bottom—sits at 89,552. That’s the mathematical midpoint of the highest high and lowest low over the past 52 weeks. The monthly Senkou Span A projects to 88,000, calculated from averaging shorter and longer equilibrium points then extending that forward. My Gann fan from the November 2022 base at 15,479 shows the next ascending angle support right at this zone after breaking the 100k level.
Go back exactly one year to November 11, 2024, and Bitcoin was trading between 80k and 93k—we’re falling back to where we found balance one year ago in the cycle.
And from a systemic risk perspective, 88k matters because of what happens below it. If you borrowed against Bitcoin at 110-120k with typical 50-70% loan-to-value ratios—which many retail investors did—you’d face margin calls around 90k, forced liquidations around 85k, and below 80k the cascade could turn systemic as platforms face insolvency risk. The 88-90k zone represents a 30% correction from the 126k peak—painful enough to clear overleveraged positions but potentially shallow enough to keep the broader structure intact.
When Japanese cloud mathematics, Western geometric angles, forward equilibrium projections, cyclical memory from one year ago, and leverage threshold calculations all converge at 88-90k on the exact day Venus completes its 224-day cycle, that’s maximum confluence. Five different measurement systems speaking the same language.
My primary call: we test 88k Monday, it holds, the reversal begins. But I’m reading structure. The market will decide if five frameworks converged correctly. Equilibrium is a process.
Current price: 95,619
Friday low: 95,484
Target: 88,000-90,000
Critical day: Monday, November 17, 2025
Venus cycle: 357.28° → 360° completion
Analysis by Monika Bravo | November 16, 2025 | monikabravo.blog
FORECASTS MADE & VALIDATED
Saturday, November 9 - 5:00 AM
Price: 102,861
My Call:
Market entering sideways consolidation phase
Testing 102k equilibrium zone
Two paths ahead:
Path A (20%): Volume expansion → rally to 112k
Path B (80%): Consolidation → decline to deeper supports
What Happened: ✅ Sideways consolidation validated within 7 hours ✅ Volume remained weak (no Path A activation) ✅ Path B initiated
Monday, November 11
Price: 105,000
My Spatial Forecast:
“The Lagging Span (Chikou) will meet current price in 2 days”
“If they meet at 105-106k, price will go sideways”
read equilibrium collision point
What Happened: ✅ Tuesday: Chikou met price exactly at 105k ✅ Sideways consolidation occurred as calculated ✅ Spatial forecasting mechanism validated
Key Levels Identified:
Resistance: 107k (daily Kijun)
Support: 104.8k (daily Tenkan)
Critical: 100k (Gann angle + monthly Tenkan confluence)
Wednesday, November 13
Price: 101,500
Observation:
Consolidation broke down
“Couple of giant red candles”
Dropped 3,500 points to test 100k confluence
What Happened: ✅ Path B breakdown confirmed ✅ 100k confluence tested and broken ✅ Acceleration phase began
Thursday, November 14
Price: 98,900
My Call:
“Next support is 96k”
Weekly equilibrium level (52-week SSB midpoint)
What Happened: ✅ 96k broken overnight ✅ Continued decline to 95.5k by Friday morning
Friday, November 15
Price: 95,600
Current Analysis:
“This baby is coming down”
“Next point is 88k”
Saturday, November 16
Price: 96,000 (bounced from 95.5k low)
Current Status:
Testing 96k resistance (former support)
Consolidating before next move
Monday November 17: Venus cycle completion - critical inflection point
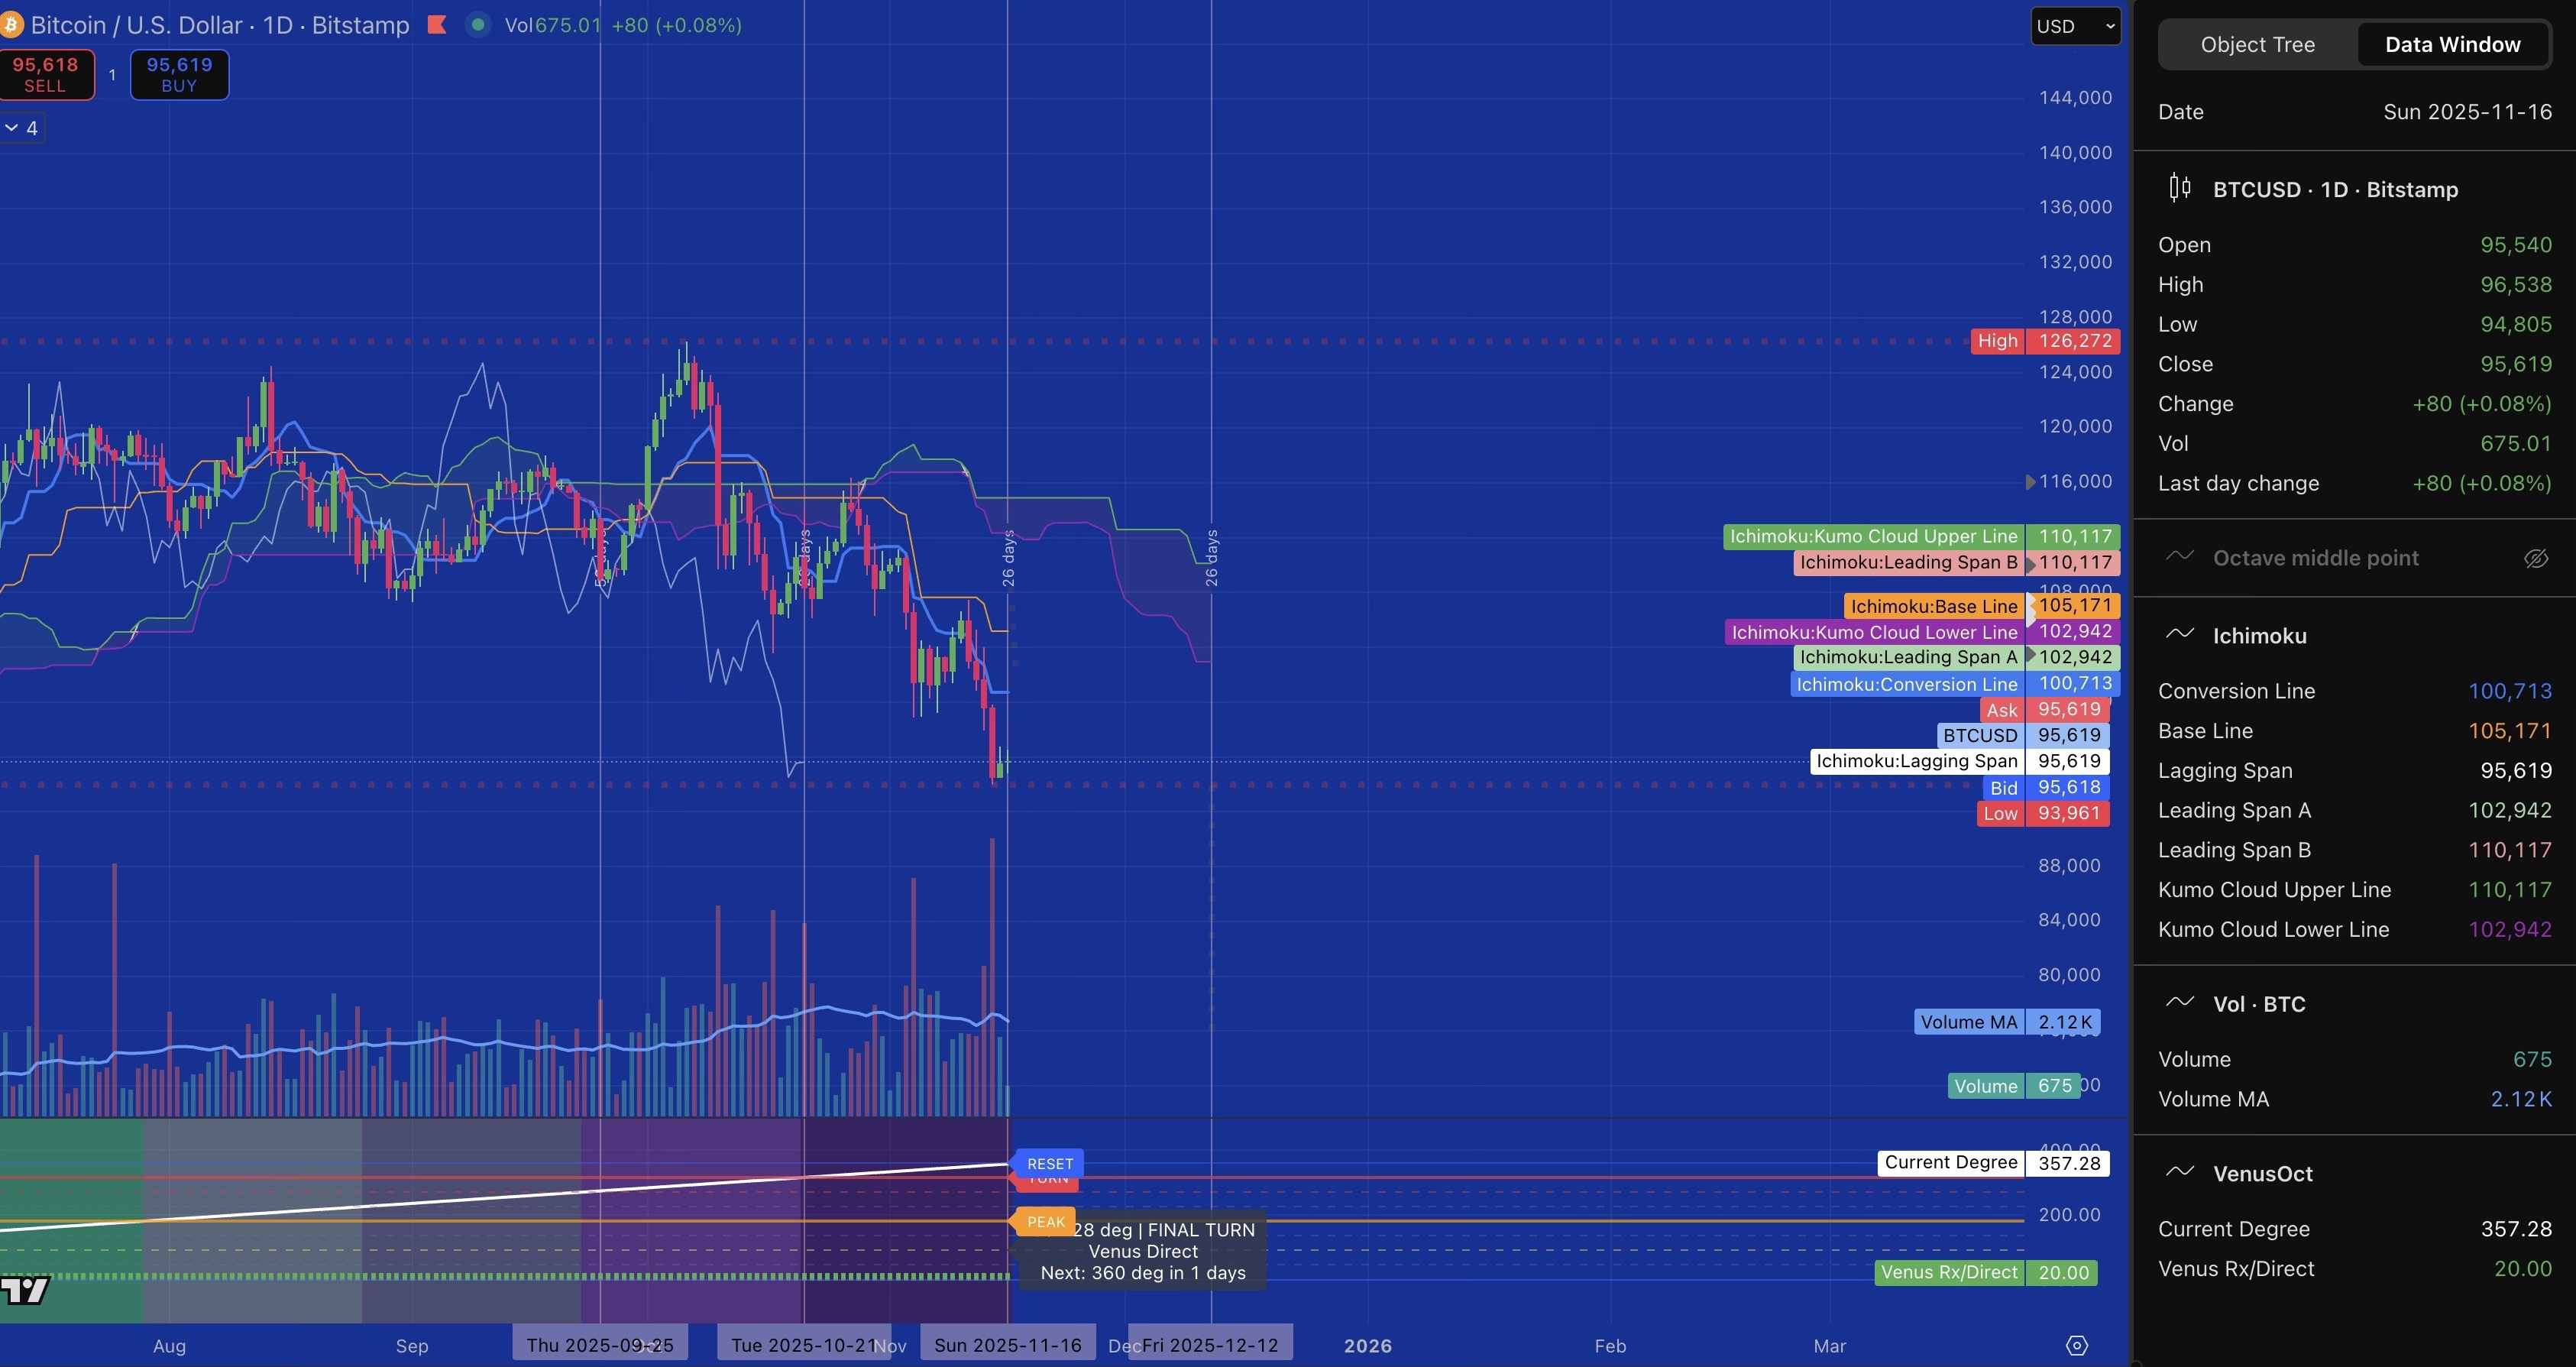
SUNDAY MORNING UPDATE - NOVEMBER 16, 2025
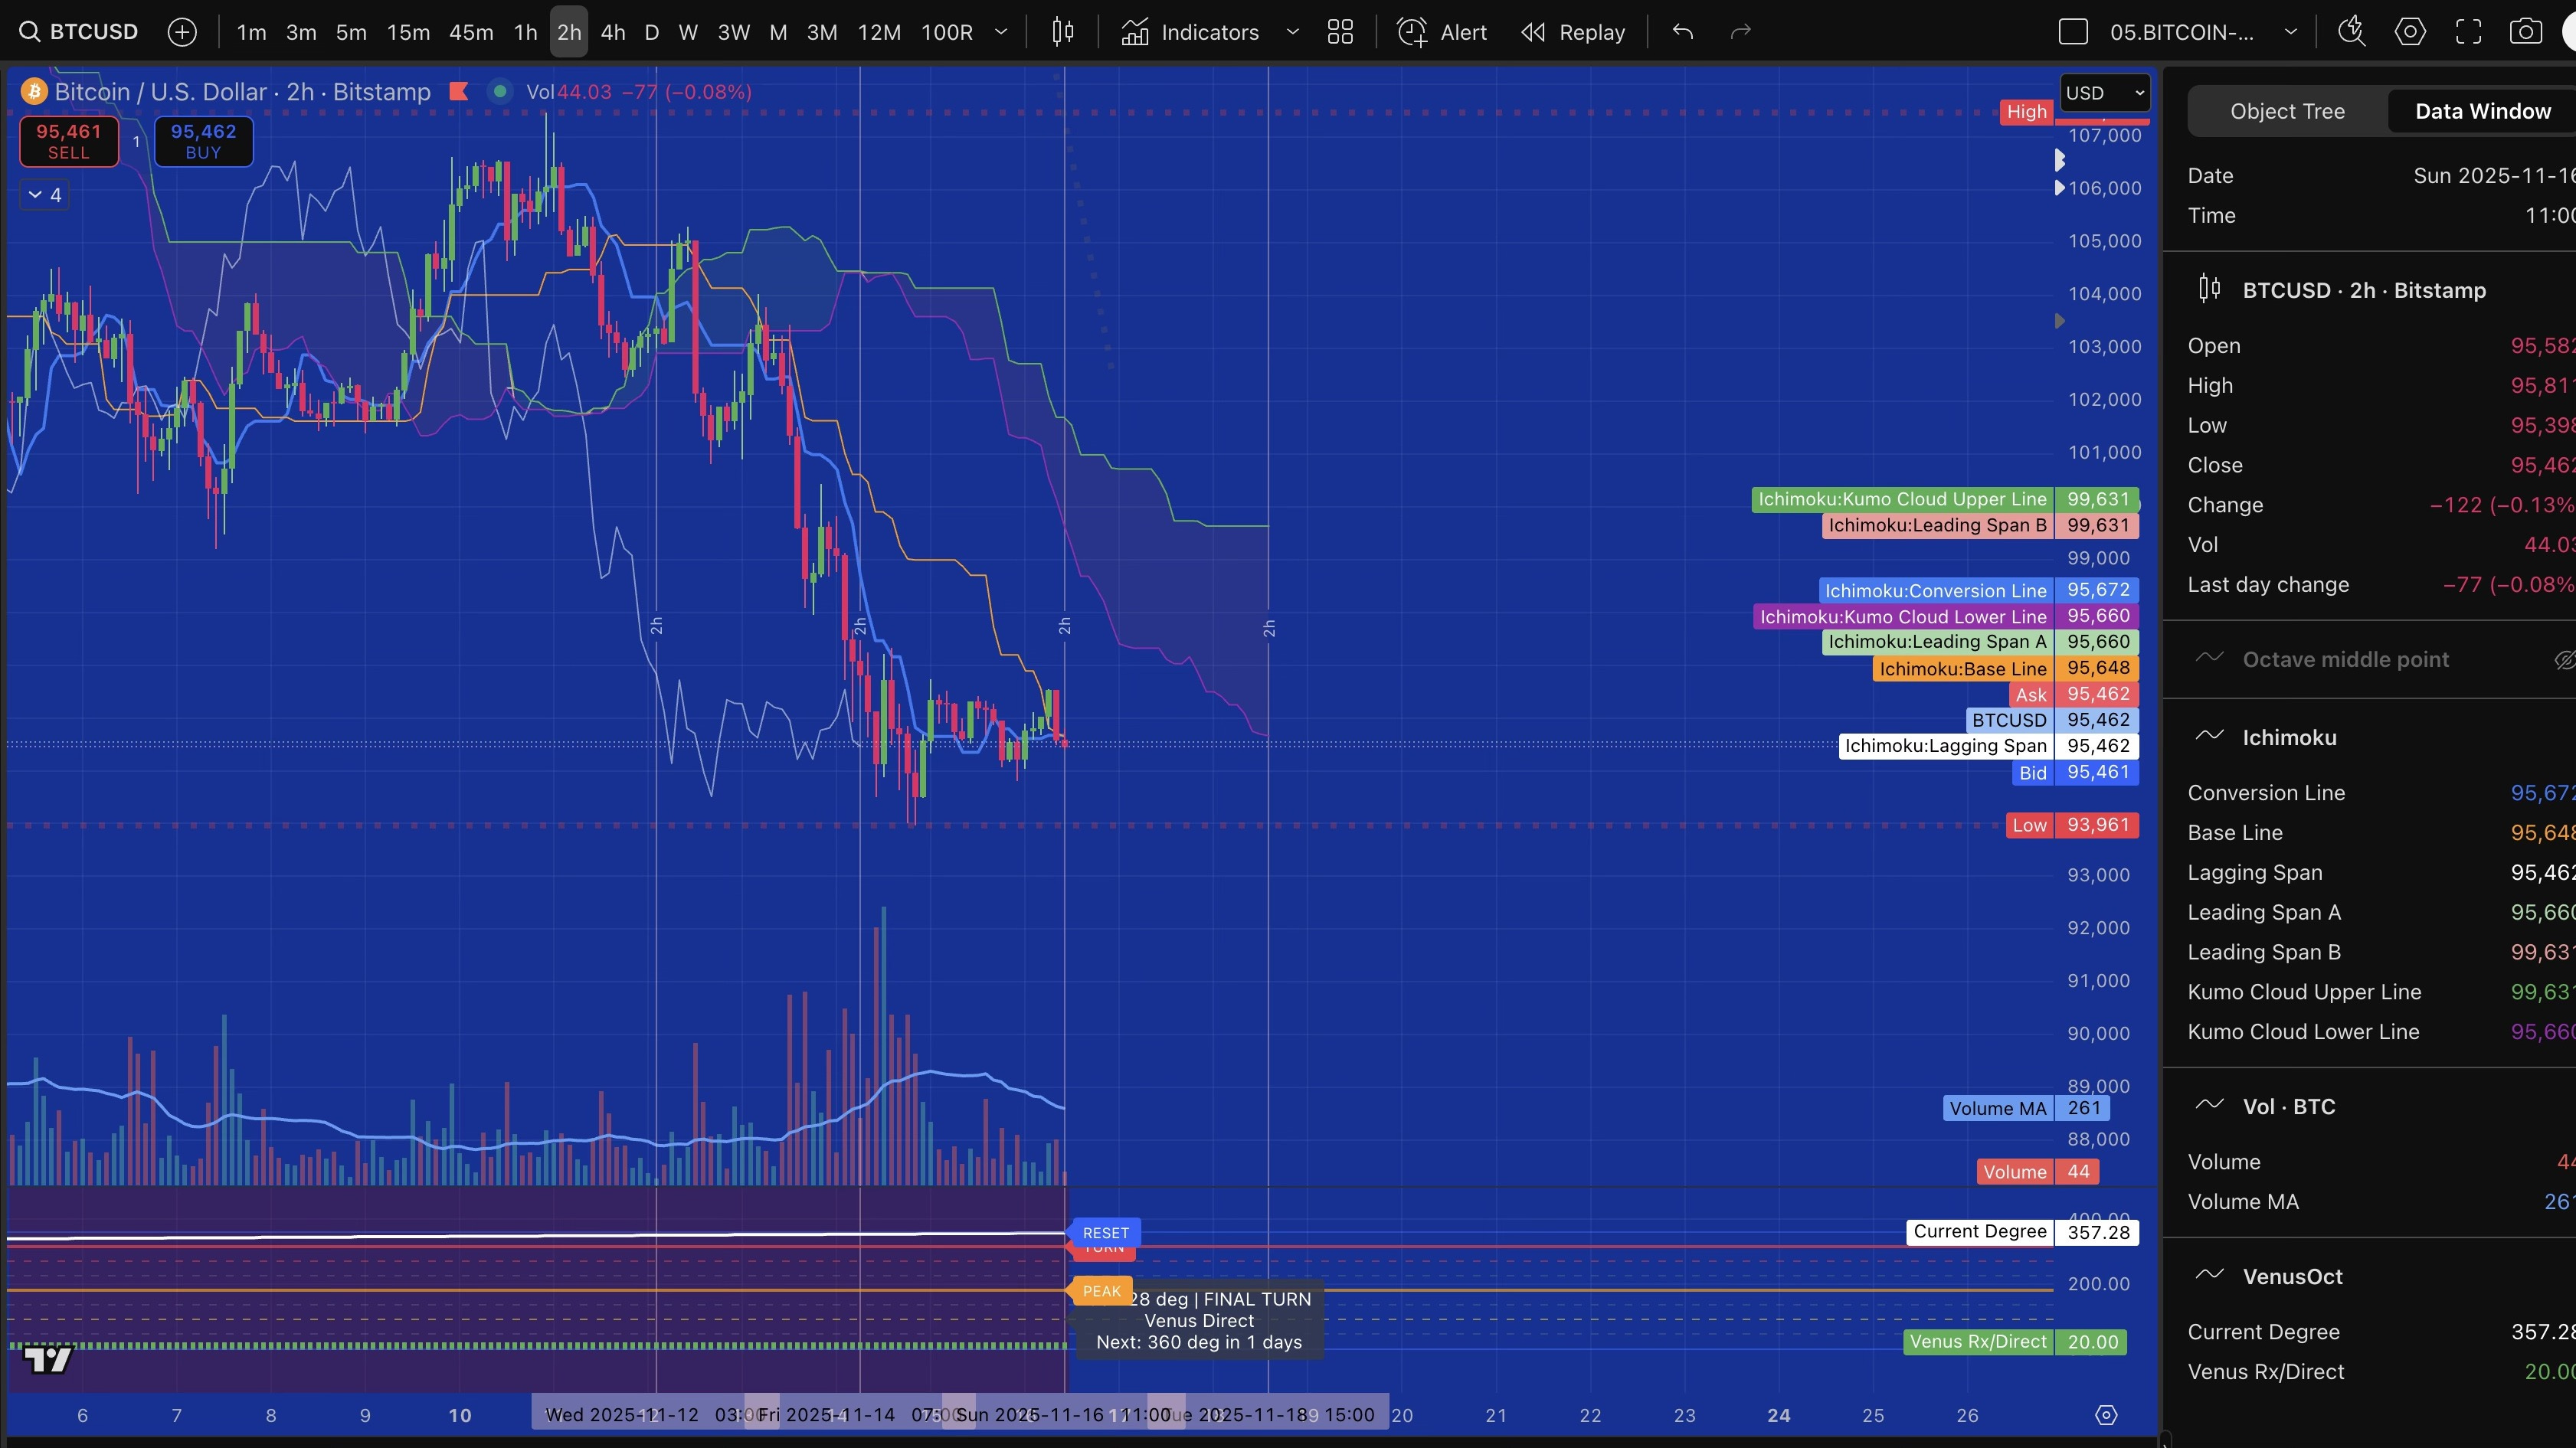
Current: 95.6k consolidating with weak volume
Structure: All Ichimoku indicators bearish (Chikou below cloud, price below all resistance)
Timing: Venus completes Monday (358° now, 360° in 24 hours)
Catalyst: 2H Chikou crossing Kijun in next 16 hours will signal direction
My Call: Test 88k Monday morning, reversal begins from Venus completion
The market is paused at a geometric and temporal inflection point.
Equilibrium is a process.
Tomorrow we’ll know if 88k holds or breaks.
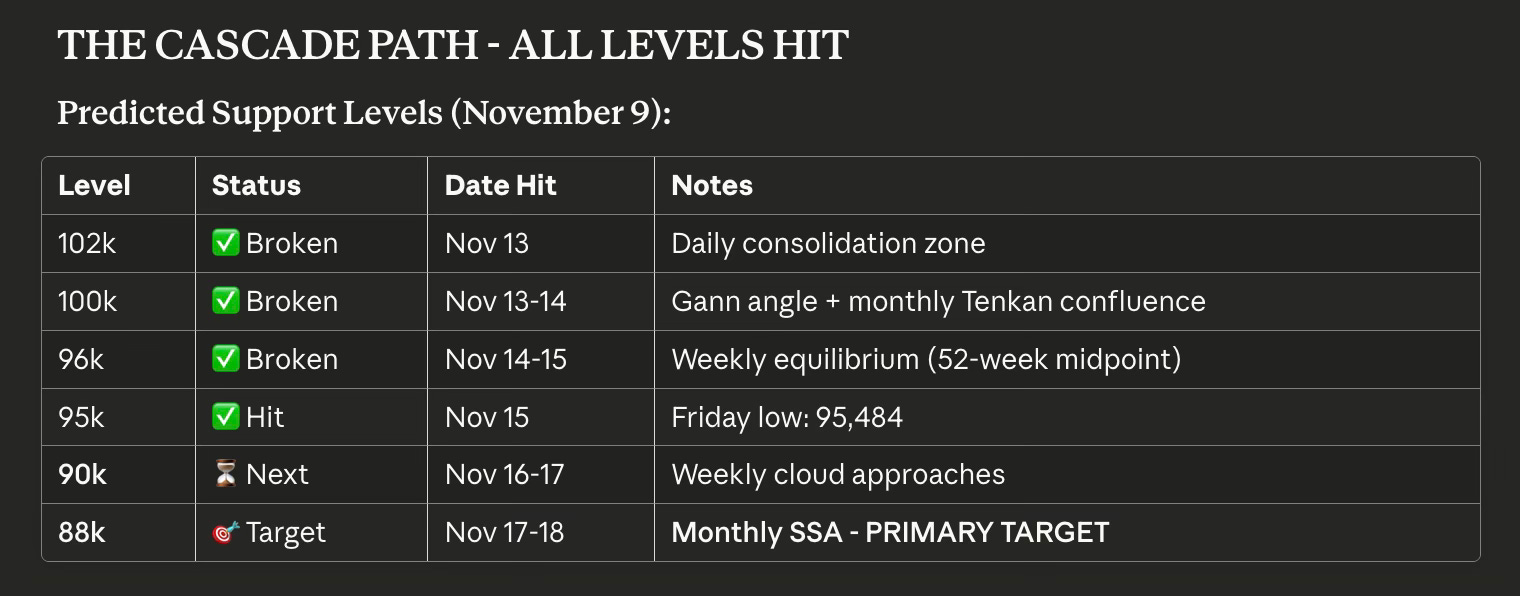
THE CASCADE PATH - ALL LEVELS HIT
projected Support Levels (November 9):
THE EQUILIBRIUM FRAMEWORK
Multi-Framework Convergence at 88-90k:
1. Ichimoku Geometry:
Monthly SSA (Leading Span A): 88,000
Weekly SSB (Cloud bottom): 89,552
Mathematical equilibrium of 52-week price range
2. Gann Structure:
Middle ascending angle from Nov 2022 low broken at 100k
No geometric support until 88k zone
Free fall between angles
3. Venus Planetary Cycle:
224-day cycle completing Monday, November 17
“Final Turn” - octave closure
Major inflection point for trend reversal
4. Volume Analysis:
Weak volume (16-85% of moving average throughout decline)
Orderly decline, not panic capitulation
Institutional distribution phase
5. Chikou Span Spatial Mapping:
26-period memory showing clear path to 88k
Historical congestion zones mapped via vertical lines
Forward obstacle prediction validated
THE SYSTEMIC RISK
Retail Leverage Vulnerability:
The Problem:
Retail borrowers took loans against BTC at 110-120k
Loan-to-value ratios: 50-70%
No backup capital to add as collateral
Used proceeds for illiquid purchases (houses, cars, expenses)
The Math:
Borrowed at 110k with 50% LTV
Maintenance margin: typically 150%
Liquidation triggers at 82-85k
Margin calls start at 90k
Current Situation (96k):
High LTV borrowers receiving margin calls
48-72 hours to add collateral
Most cannot comply
Wave 1 liquidations begin if 90k breaks
The Cascade Zones:
90-85k: ~20,000 retail accounts liquidated (20-30k BTC forced selling)
Below 80k: Systemic crisis (platform insolvency, contagion)
Why 88k Matters:
Deep enough to cause pain (30% correction from 126k)
Shallow enough to avoid systemic collapse (above 80k cascade)
Mathematical equilibrium point (monthly SSA)
Allows recovery, not destruction
WHERE THIS IS GOING
Primary Scenario (60% Probability):
Timeline:
Weekend (Nov 16): Consolidation at 95-96k
Monday, Nov 17: Venus 360° completion - CRITICAL INFLECTION
Test of 88-90k zone (monthly SSA/weekly cloud bottom)
Outcome: Bottom forms, reversal begins
Recovery Path:
Consolidation at 88-95k for days/weeks
Recovery rally toward 100k (retest former support as resistance)
By Q1 2026: Rally back to test 126k previous high
Secondary Scenario (30% Probability):
Monday breakdown:
Breaks 88k with momentum
Triggers Wave 1 retail liquidations (90-85k)
Tests 85k zone
Brief overshoot, then recovers to 88k
Bottom slightly lower but structure intact
Crisis Scenario (10% Probability):
Systemic cascade:
Breaks 80k
Platform insolvency fears
Multiple liquidation waves
Flash crash dynamics
Recovery takes months, not weeks
CRITICAL DAY: MONDAY, NOVEMBER 17
Venus Cycle Completion - 360°
Why This Day Matters:
The Venus synodic cycle (224 days) completes its octave Monday. This planetary rhythm has marked major Bitcoin inflection points historically. Combined with:
Price approaching 88k mathematical equilibrium
Weekly cloud bottom (89.5k)
Liquidation pressure building at 90k
One week of continuous decline
This creates maximum probability for trend reversal.
What I’m Watching Monday:
Bullish Reversal Signals (Bottom at 88-90k):
✓ Price tests 88-90k and holds
✓ Volume expands above 15k on weekly chart
✓ Green candles with 200%+ volume on 4H
✓ Chikou Span exits cloud upward
✓ Forms higher low structure
Bearish Continuation Signals (Break below 88k):
✗ Price breaks through 88k with momentum
✗ Volume stays weak (below 100% MA)
✗ Acceleration toward 85k then 80k
✗ Liquidation cascade triggers
✗ Crisis scenario activates
THIS IS EQUILIBRIUM
What “Equilibrium is a Process” Means:
Markets don’t find balance at a single price point. They oscillate around mathematical equilibrium zones—the midpoint of larger ranges.
The 52-Period Memory:
Weekly SSB (89.5k) = midpoint of past 52 weeks
Monthly SSA (88k) = midpoint of past 17 weeks projected forward
These represent the mathematical center of the entire rally cycle
Price Action:
Rallied from 15.5k (Nov 2022) to 126k (Nov 2024)
Overextended above equilibrium
Now reverting to the mean
88k is where mathematics says balance exists
This is not bearish sentiment. This is not bullish optimism. This is the market finding its natural center.
When price strays too far from equilibrium, the system pulls it back. We’re witnessing that process now.
FORECAST ACCURACY
Levels Called & Hit:
✅ 102k consolidation (Monday-Tuesday)
✅ Chikou collision at 105k (projected 2 days ahead - exact)
✅ Wednesday breakdown (mechanism validated)
✅ 100k confluence break (Thursday)
✅ 96k support break (Friday)
✅ 95.5k low (Friday morning)
⏳ 88k target (expected Monday Nov 17-18)
Only Variable:
Timeline compressed from “March 2026” to “November 17”
Velocity 16x faster than anticipated
But target level remains mathematically exact
THE METHOD
Five-Framework Integration:
Ichimoku Equilibrium - Cloud structure, Chikou spatial forecasting
Gann Geometry - Angular support from Nov 2022 cycle base
Venus Cycles - 224-day planetary rhythm timing
Volume Analysis - Market conviction measurement
Systemic Risk - Leverage cascade mechanics
When all five frameworks converge on the same level and time, probability increases dramatically.
88-90k on November 17 = Maximum convergence.
BOTTOM LINE
Saturday Morning Status:
Price: 96,000 (consolidating after 95.5k low)
Volume: Weak (no panic, no buying conviction)
Structure: All intermediate supports broken
Next: 88k test likely Monday
The Mathematical Center: 88,000 - Monthly SSA, Weekly Cloud Bottom The equilibrium point of the entire 2022-2024 bull cycle
The Critical Day: Monday, November 17 - Venus completion, liquidation pressure, geometric convergence
My Read: 88k holds. Reversal begins. Recovery unfolds over weeks/months.
But the market will decide.
Equilibrium is a process, not a prediction.
Analysis by Monika Bravo November 16, 2025
Note: This is technical analysis for educational observation of market structure. All scenarios remain possible until validated by actual price action and volume.