


Welcome to “Equilibrium is a Process” — a new section for Bitcoin wavelength analysis.
You’re receiving this introduction via email. Future weekly posts will live in a dedicated section (linked from main feed updates), so your inbox stays clear. 🌊
📊 INTRODUCTORY POST → BITCOIN TECHNICAL ANALYSIS
MY WHY:
Why I study Bitcoin through Ichimoku, Gann, Fibonacci, and pattern recognition:
It’s all about vibration, movement, and frequencies within wavelengths.
OBSERVE + CORRELATE:
When I step back and observe objectively—without projecting my fears or insecurities—I start recognizing wavelengths everywhere. The same patterns in life cycles, in market movements, in price equilibrium, and momentum.
Ichimoku shows me where equilibrium exists across multiple timeframes. The Kijun line is the gravity center that holds the wave, like a surfer’s stance on that edge of balance.
Gann shows me when cycles complete and new phases begin, just like astrological aspects: new moons, full moons, and quarter moons. Or musical octaves.
Fibonacci reveals the natural ratios where waves pause, turn, and resume—the same golden proportions found in nature, music, and art.
Volume shows me how much conviction backs each move. The inflow and outflow. The breath behind the wave.
It’s all about harmonics.
COMMITTED TO TRUTH (through accountability)
The same pattern recognition I developed reading astrological charts—tracking planetary cycles, aspects, and timing—translates directly to reading market structure.
Both systems ask the same question: Where are we within the cycle?
When you understand that markets breathe in waves (impulse, correction, impulse) and time moves in geometric divisions (45°, 90°, 180°), the chart becomes a visual frequency you can read.
This is observing patterns that already exist.
To some, this looks like chaos. I see rhythm.
To some, random price moves. I see harmonic cycles completing.
That’s why I’m committing significant time to master Bitcoin TA. Not as a trader—as a technical analyst. Because reading these patterns gives me tranquility. It’s meditation through observation.
I’ll be sharing these wavelengths as I study them. If you feel compelled to follow along, welcome. If not, that’s fine too.1
📖 QUICK TERMINOLOGY GUIDE
Think of these as the musical notes in the price wavelength:
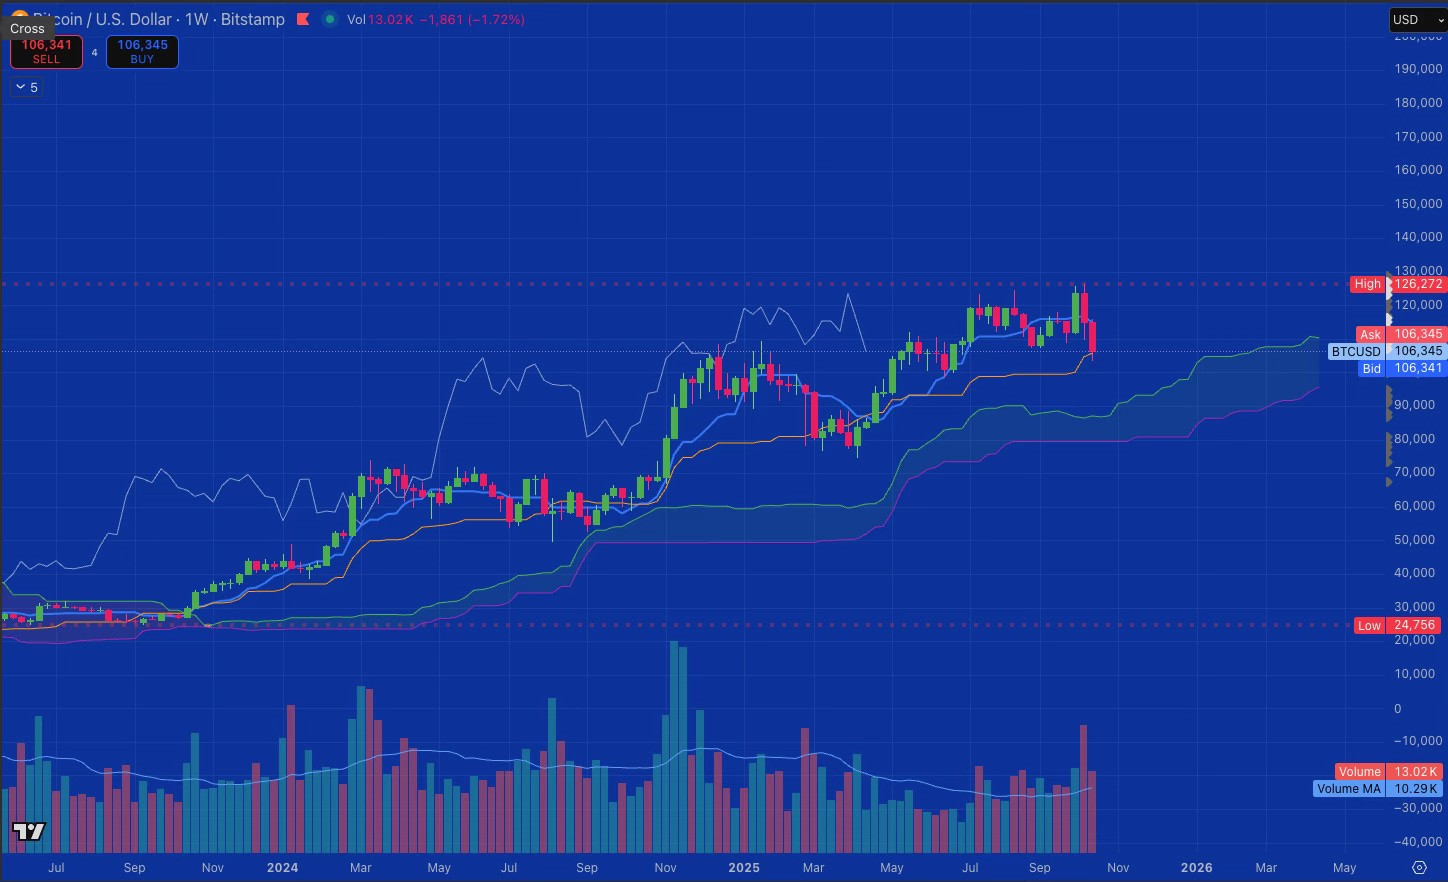
ICHIMOKU - The Equilibrium System ⚖️
Tenkan (9-period average): The short pulse
→ Fast-moving equilibrium line
→ First harmonic of momentum
→ “Where was balance 9 periods ago?”
Kijun (26-period average): The gravity center ⭐
→ Medium-term equilibrium = 0.5 Fibonacci (50%)
→ The axis where price naturally returns
→ Like a surfer’s center of gravity on the wave
→ “Where is the center of this wavelength?”
Chikou Span (26-period lag): Market memory
→ Current price plotted 26 periods back
→ Shows if current wave validates past structure
→ “Does this move align with where we’ve been?”
Cloud (Kumo): The future prediction zone
SSA (Leading Span A): Recent momentum projected forward
SSB (Leading Span B): Long-term structure projected forward
→ Shows where support/resistance will be in 26 periods
→ “Where will the wave meet resistance ahead?”
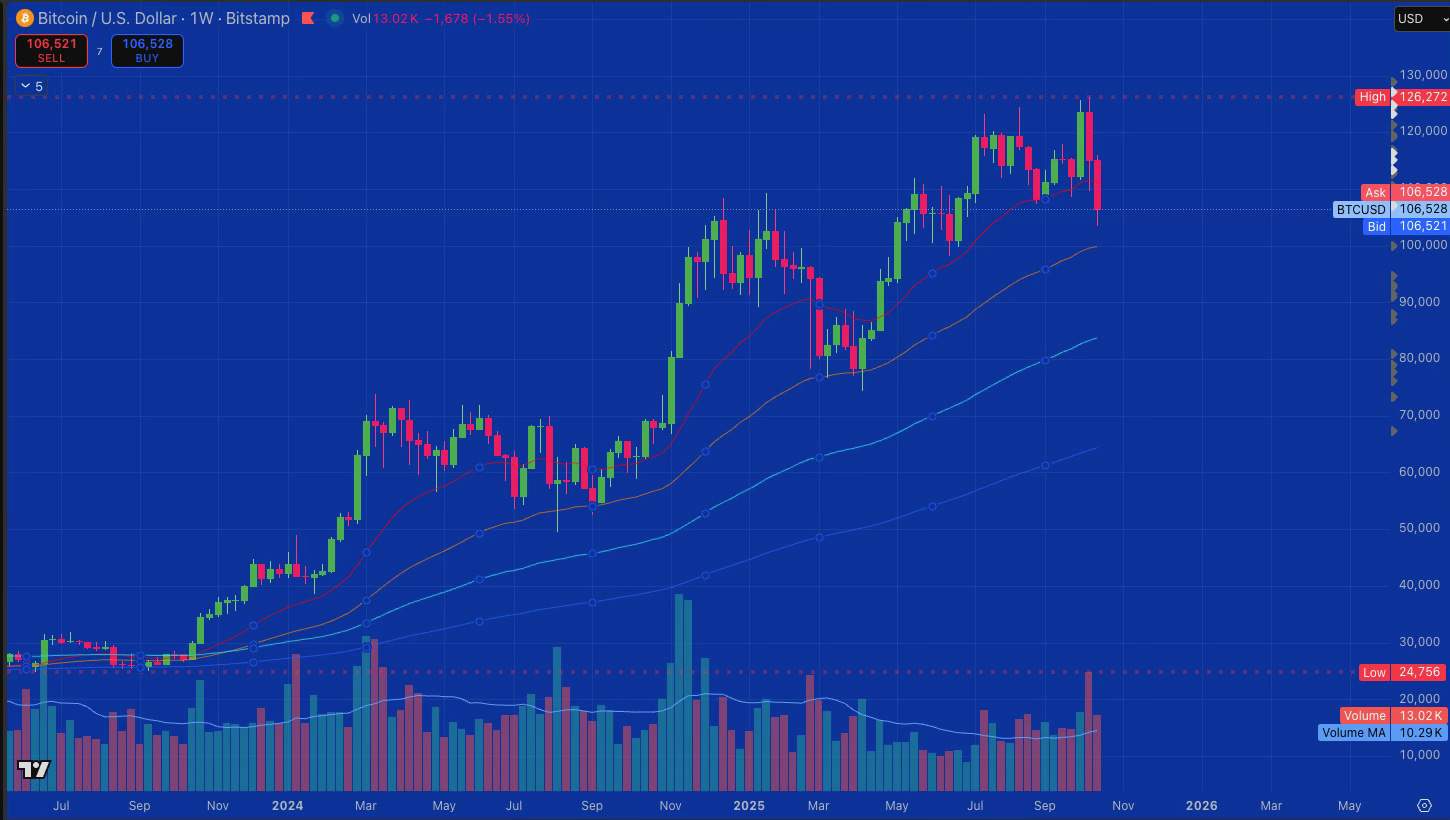
EMA - Exponential Moving Averages (Directional Flow) 📈
EMA 20: Recent momentum current
→ Fast-reacting average weighted toward recent price
→ Shows immediate directional flow
→ “Where is the recent current pulling?”
EMA 50: The prevailing tide
→ Intermediate trend direction
→ Often aligns with Kijun (26) for confluence
→ “What direction is the tide moving?”
EMA 100: The undertow
→ Major trend structure
→ Strong support/resistance in trends
→ “Where is the deeper current?”
EMA 200: The ocean current ⭐
→ Primary trend definition
→ Bull market: above EMA 200 | Bear market: below
→ Most respected moving average globally
→ “What is the dominant force?”
How EMA differs from Ichimoku:
→ Ichimoku = equilibrium blocks (where balance exists)
→ EMA = smooth flow curves (where momentum is moving)
→ Together = structure meets current
→ When Kijun ≈ EMA 50 at same level = double confluence ⭐
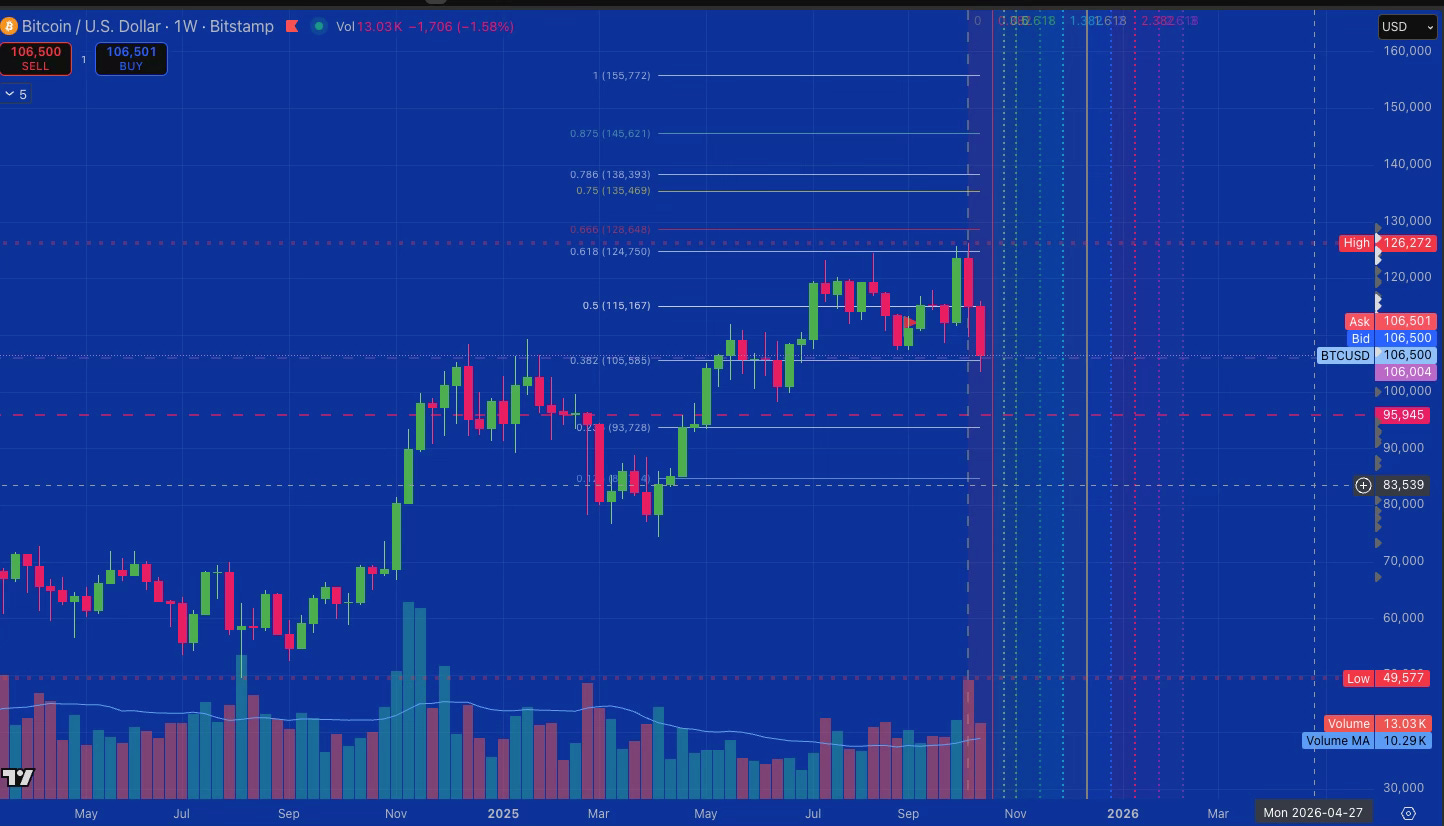
FIBONACCI - Natural Harmonic Ratios 🌀
0.236 (23.6%): Shallow harmonic
0.382 (38.2%): Strong harmonic (minor wave correction)
0.5 (50%): Perfect balance = Kijun equilibrium ⭐
0.618 (61.8%): Golden ratio (major wave correction)
1.0 (100%): Full wavelength completion
1.618 (161.8%): Golden extension (new wave projection)
→ These are the natural pause points where waves breathe
→ Found in nature, music, art, and markets
→ “Where does the wave naturally rest?”
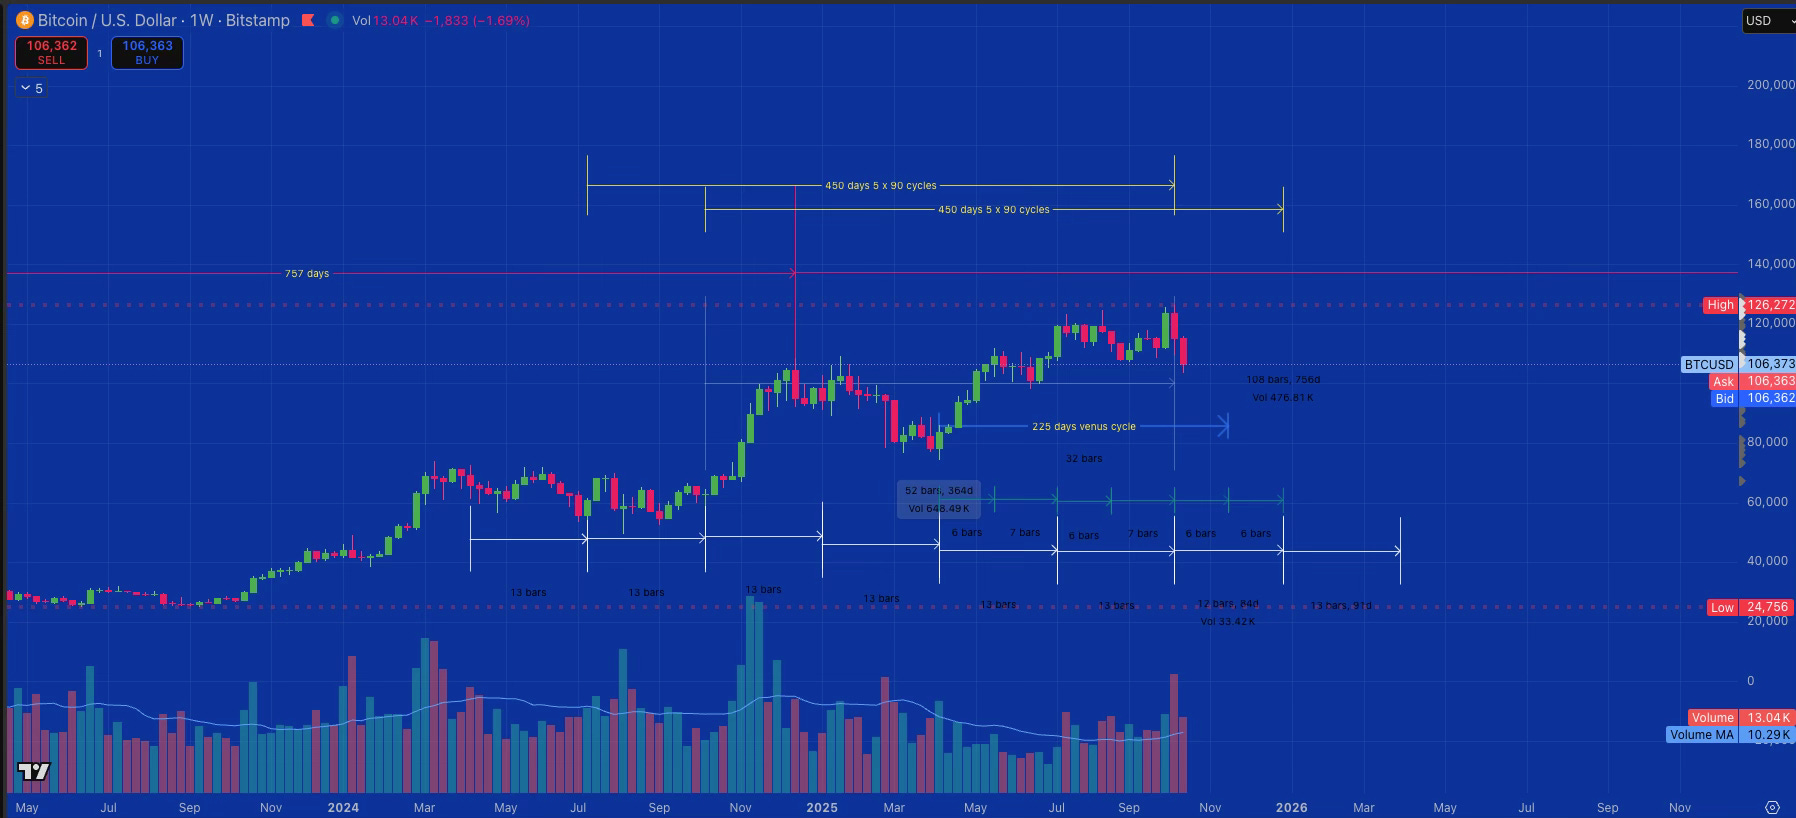
BASIC GANN CYCLES - Time Geometry ⏰
45-day cycle: Basic market rhythm unit
90-day (45×2): Quarter cycle / Square turn
180-day (45×4): Half cycle
225-day (45×5): Venus cycle / 5th harmonic ⭐
360-day (45×8): Full cycle / Complete octave
→ Markets move in geometric time divisions
→ Like musical octaves or lunar phases
→ “When does the cycle complete and reverse?”
VOLUME - The Conviction Behind the Wave 🔊
>150% of average: High conviction (strong inflow/outflow)
100%: Normal breathing
<50%: Low conviction (weak breath)
250%+: Capitulation/climax (wave peak or trough) ⭐
→ Measures the energy behind price movement
→ Like amplitude in a sound wave
→ “How much force is behind this move?”
WAVE PATTERNS - Market Breath 🌊
Impulse: Strong directional move (exhale)
Correction: Pause/retracement (inhale)
Consolidation: Sideways equilibrium (holding breath)
Exhaustion: Volume drops after extreme move (breath depletes)
→ Markets breathe in rhythmic cycles
→ Three waves forward, two waves back
→ “Is the market breathing in or out?”
CONFLUENCE - Where Frequencies Align ✨
When multiple systems point to same level:
→ Kijun (0.5 equilibrium) + Fibonacci 0.382 + Chikou memory
→ = Maximum resonance = Strongest support/resistance
→ Like musical harmony: multiple notes create one chord
→ “Where do all the wavelengths meet?”
HOW I USE THESE TOGETHER:
Ichimoku = Where is equilibrium NOW (present wave structure)
Chikou = Does this align with memory? (past validation)
Cloud = Where will we meet resistance? (future projection)
EMA = Which direction is momentum flowing? (current trend) ⭐
Fibonacci = Where do waves naturally pause? (harmonic ratios)
Gann = When do cycles complete? (time geometry)
Volume = How much conviction? (wave amplitude)
When all seven align = Maximum confidence level
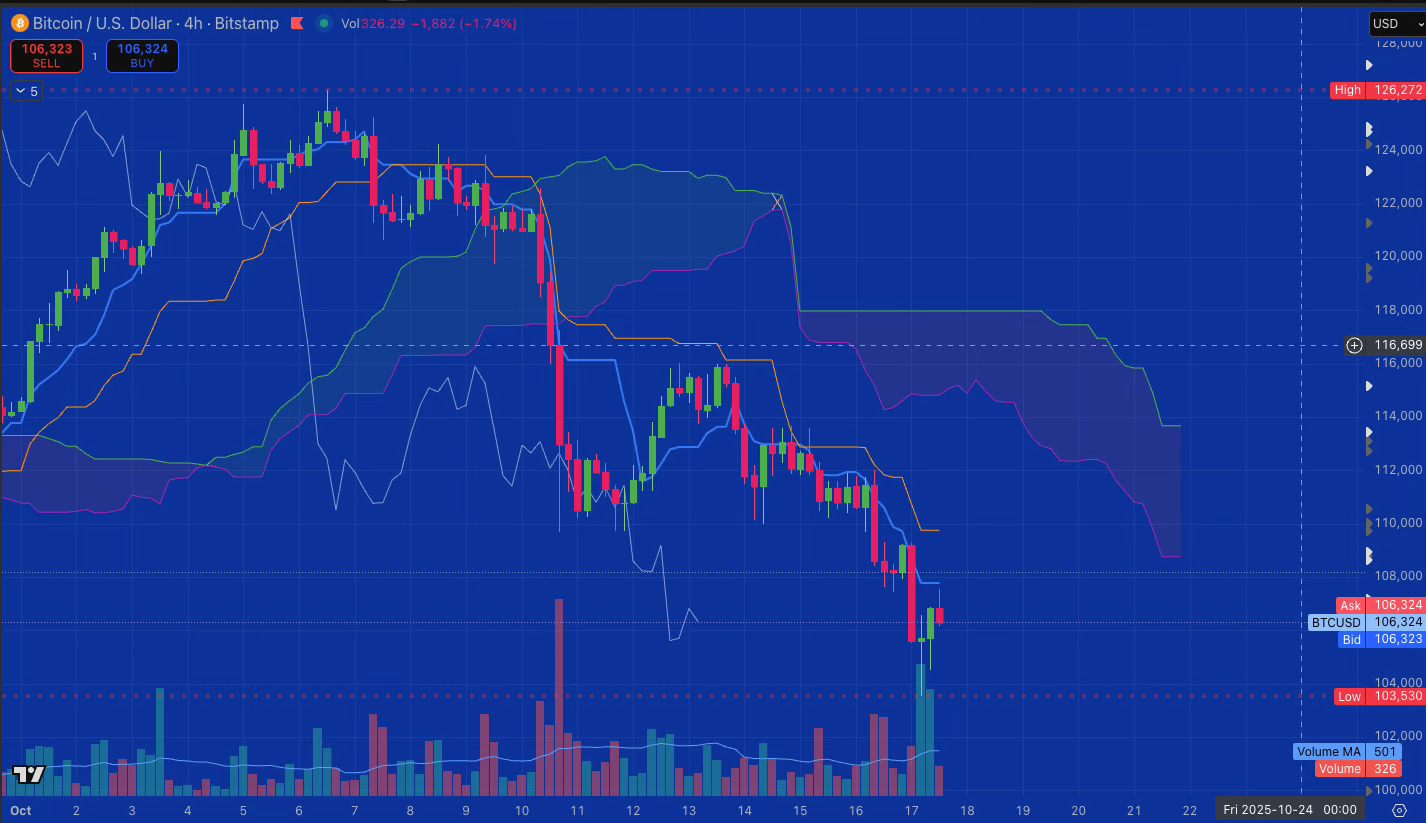
EXAMPLE FROM THIS WEEK 10/14-10/17:
October 17, 2025:
→ Price: 105.68k
→ Weekly Tenkan: 105.7k (9-week equilibrium) ✅
→ Fibonacci 0.382: 105.5k (natural harmonic) ✅
→ Weekly Chikou: 105.8k (market memory) ✅
→ Daily EMA 200: 105.9k (ocean current support) ✅
→ Gann cycle: Oct 17 change window ✅
→ Volume: 250%→250%→30% (exhaustion) ✅
= All frequencies + flow directions aligned at one point
= Maximum resonance support level
This is how I read the rhythm.
PERSONAL ASPIRATION:
📊 A Seasoned Bitcoin Technical Analyst
🔄 Synthesizing Ichimoku • Gann • Fibonacci • Volume • EMA
🌊 Wavelength observer | Pattern reader
⚠️ For entertainment & educational purposes | Not financial advice
If this resonates, follow along. If not, may your own path be clear.
The wavelengths are always there. You just have to learn to see them. 🌀
GLOSSARY POST
For those who want deeper understanding, here’s what I track:
Weekly timeframe: Long-term wave (macro trend)
Daily timeframe: Medium-term wave (swing structure)
4H timeframe: Short-term wave (momentum shifts)
Tenkan crosses Kijun: Momentum shift (new wave begins)
Price crosses cloud: Trend change (wave direction reverses)
Price crosses EMA 200: Major trend shift (current reverses) ⭐
Kijun ≈ EMA 50 confluence: Structure + flow alignment
Chikou validates: Memory confirms (past aligns with present)
Fibonacci confluence: Natural pause point (harmonic rest)
Gann time window: Cycle completion (phase change)
Volume exhaustion: Wave depletes (reversal imminent)
All of this is observable. None of it is predictive—it’s descriptive of patterns that already exist in the frequency.
I’m simply reading the rhythm that’s already playing. 🎵
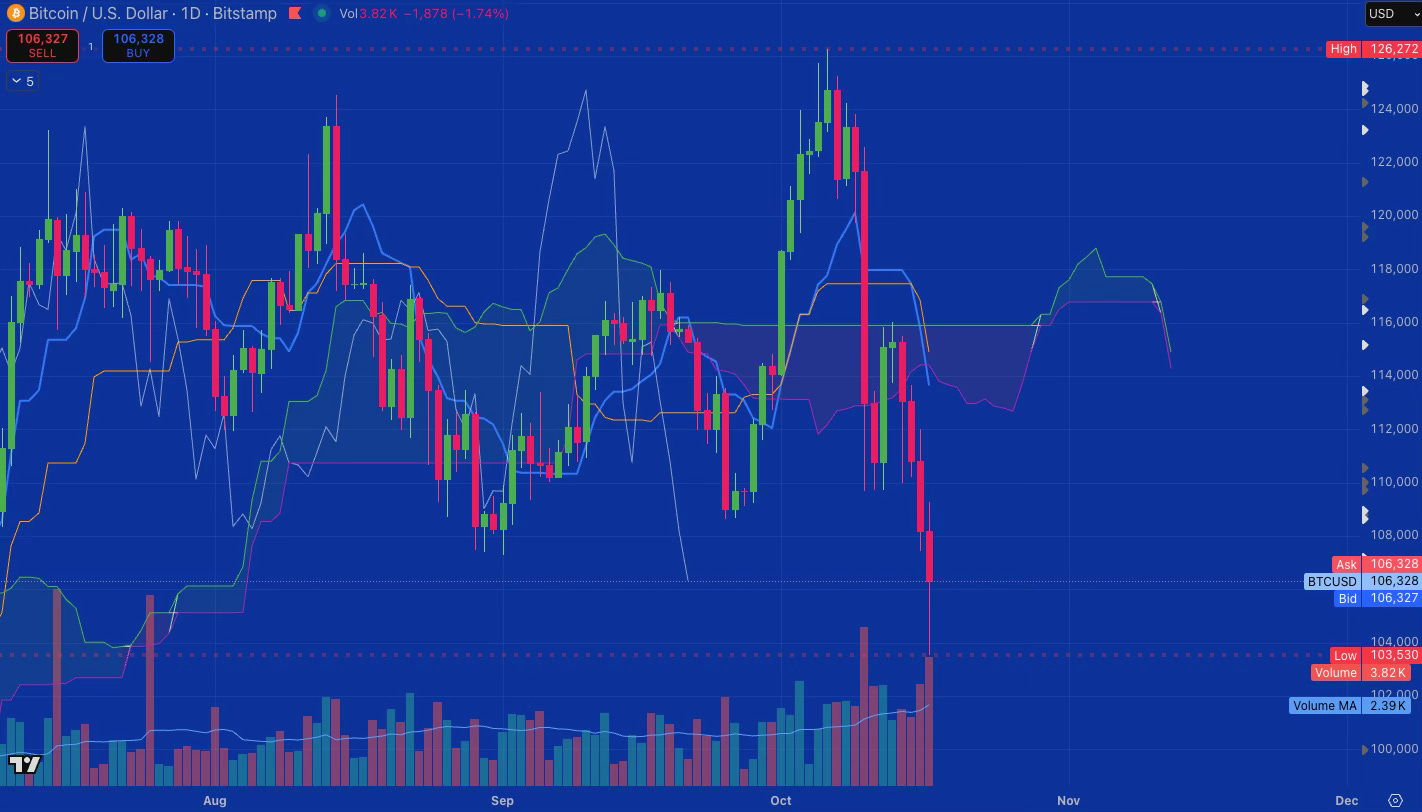
WEEK OF OCTOBER 14-17, 2025 SUMMARY:
Bitcoin consolidated 110-113k with declining volume (50-75% MA) as predicted. Major breakdown occurred with 200% volume on October 16, followed by second 250% capitulation wave2 on October 17, reaching EXACTLY the predicted Weekly Tenkan support at 105.7k.
Multi-system confluence created maximum-strength support:
Weekly Tenkan: 105.7k (9-week equilibrium/Ichimoku)
Fibonacci 0.382: 105.5k (natural harmonic retracement)
Weekly Chikou: 105.8k (52-period market memory validation)
Daily EMA 200: 105.9k (major trend current) ⭐
Gann time: Oct 17 change window
Volume: 250%→250%→30% exhaustion pattern
Current volume exhaustion (30% MA) suggests selling climax. Weekly Chikou Span at 105.8k (same level as price) is critical decision point for bounce or break.
October 17 prediction validated as major change date.
“If prices bounce off the Kijun, the break in the trend is merely a brief breather, or pullback, in the market before it resumes. On the other hand, if prices pass through the Kijun, the direction of the prevailing movement becomes obsolete.”
— Karen Péloille, Trading with Ichimoku
Fibonacci time marker October 20 (Monday) + Gann Venus cycle November 17 provide time-price symmetry for potential rally to 113-116k by November 10-17 (bull market continuation).
Market context: Bitcoin remains in bull market structure (Weekly green cloud, price above major support). This week’s 105k test determines if the correction ends and bull continues (65-70% probability if support holds) or if deeper retracement to 95.6k unfolds. This is a correction within the existing uptrend—not a new bull market beginning.
Original thesis: Timing perfect (Oct 17), direction corrected (down then up), target delayed one week but achievable.
Support MUST hold above 105k (Weekly Tenkan + EMA 200) or break to 95.6k (Weekly SSB).
Current probability: 65-70% bounce begins Monday-Tuesday.
have a great week
Thanks to my ANON friend T.K. for initiating me in this wonderful journey + I thank myself for having the courage to dwell in it with joy and curiosity.
Capitulation wave: High-volume selling exhaustion where weak hands exit at lows, often marking a bottom. Like a wave crashing with maximum force before the tide turns.