

Bitcoin's Invisible Cage: How Options Dealers Control Price Action
Dec 26 expiry and what happens after...

December 25, 2025 Happy Santa & Baby Jesus day.
Before I dive in, let me be clear about something: I’m studying to become a great market analyst, not a trader. And why? Because looking at markets helps me regulate my nervous system. Yep, you read that right.
I’ve been using trained LLMs as tutors - feeding them long articles about Gann, Ichimoku, and other techniques, then having conversations to understand what I’m seeing. I read Bitcoin charts every morning. I’ve gone from feeling nervous to look at them, to feeling comfortable, to wanting to educate myself deeper in all these themes.
This article is about one of those learning moments → when my charts showed one thing, but price did another, and I had to understand why.
I’ve been staring at my Bitcoin charts for weeks now, and something doesn’t add up.
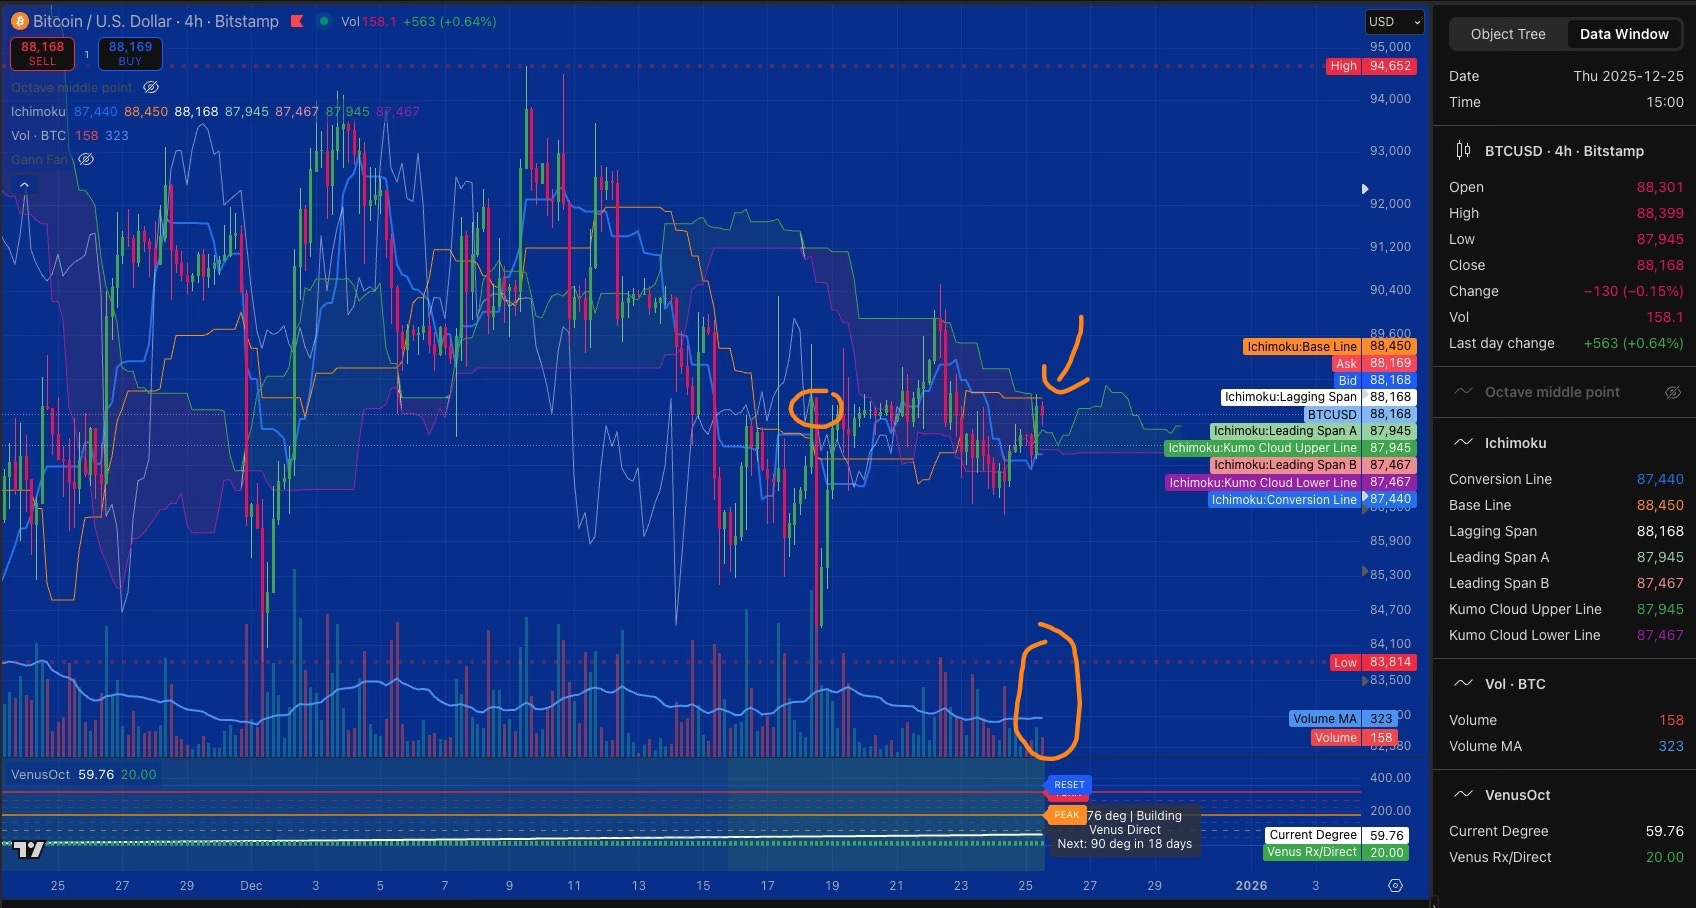
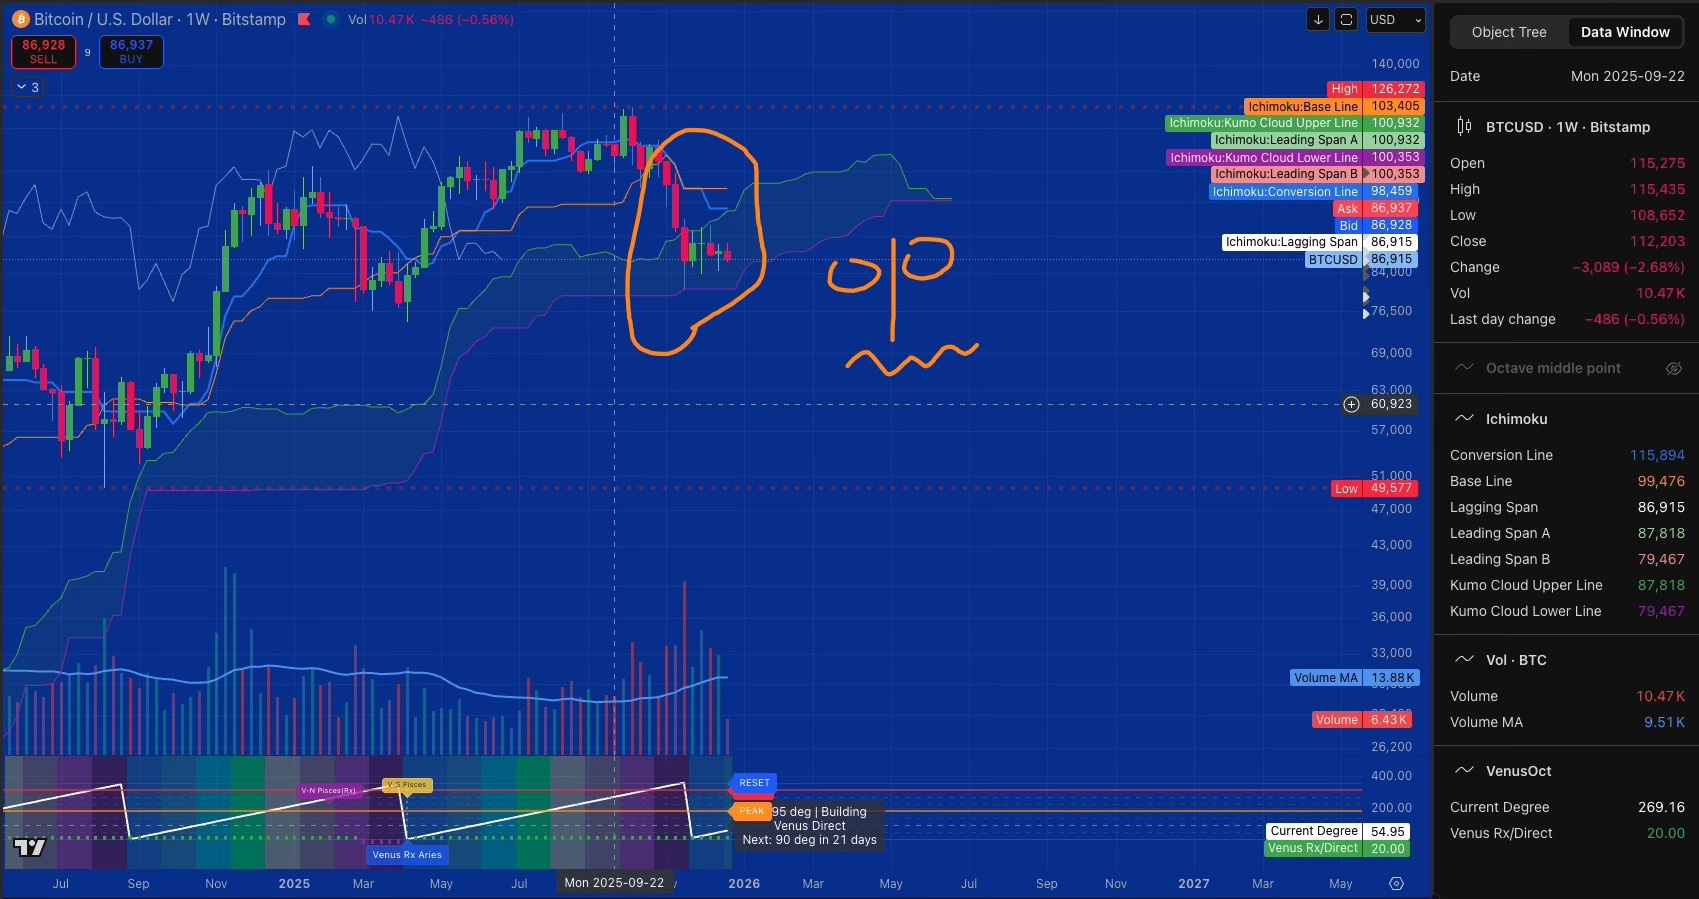
My weekly Ichimoku shows six consecutive weeks grinding inside the cloud; a massive indecision zone. My daily timeframe? Fully bearish. Price sits below the Tenkan (conversion line), below the Kijun (base line), below the cloud. Three red candles in a row. Volume has collapsed to just 47% of average. The Chikou Span (lagging indicator) is about to cross downward, which would confirm a bear market.
Every technical indicator I track says Bitcoin should be breaking down. Hard.
But it’s not. Price just... sits there. Hovering between $85,000 and $90,000, barely moving, like it’s glued in place.
So I asked: “What’s actually happening here? And how much control do regular traders—retail people like me—actually have over Bitcoin’s price right now?”
The Question That Started Everything
Here’s what I wanted to know: If Ichimoku is bearish across multiple timeframes, if volume is dead, if all my technical signals point down... why won’t Bitcoin move?
And more importantly: Since the price seems “locked” by some kind of institutional maneuvering, how much freedom do retail traders actually have over Bitcoin’s price action?
I build frameworks, track patterns, try to understand the “why” behind moves. And right now, the “why” wasn’t making sense.
What I Learned About Options (Simply Explained)
Let me break down what I discovered, piece by piece, the way it was explained to me.
What’s an Option?
Think of it like a reservation at a restaurant. You pay a small fee upfront to lock in a table at a specific time. If you show up, great—you get your table at the agreed price. If you don’t, you just lose the reservation fee.
An option on Bitcoin works the same way:
A Call Option = You pay a fee today for the right to buy Bitcoin at a specific price (say, $90,000) by a specific date. If Bitcoin goes to $100,000, you still get to buy at $90,000. If it drops to $70,000, you just walk away and lose your fee.
A Put Option = You pay a fee for the right to sell Bitcoin at a specific price (say, $85,000). If Bitcoin crashes to $60,000, you still get to sell at $85,000. If it rallies, you walk away.
The fee you pay upfront is called the premium. The locked-in price is the strike price. The expiration date is when your reservation runs out.
Sounds simple enough, right? Here’s where it gets interesting.
Who Are “Dealers” and Why Do They Matter?
When you want to buy an option, someone has to sell it to you. That someone is usually a dealer—big institutions, banks, market makers. They’re like the casino. They don’t gamble on which way price will go. They just facilitate the game and take a cut.
But here’s the problem: when a dealer sells you an option, they’re exposed to risk. If they sell you a $90,000 call option and Bitcoin shoots to $100,000, they owe you $10,000. They don’t want that risk.
So they hedge—they protect themselves by buying or selling actual Bitcoin to offset their exposure.
This is the key: Dealers selling options → having to hedge → buying/selling Bitcoin to stay neutral → which moves the price.
You think retail traders are moving the market. But right now, it’s dealers mechanically hedging their option positions that control where price can and can’t go.
What Is Gamma? (The Acceleration Factor)
Stay with me here. This gets a bit technical, but it’s worth understanding.
Gamma measures how fast a dealer’s hedge needs to change when price moves.
Think of driving a car:
Your speed = how much the dealer needs to hedge right now
Gamma = your acceleration = how fast that hedging requirement is changing
High gamma means small price moves require HUGE hedging adjustments from dealers. They have to trade massive amounts of Bitcoin just to stay neutral.
Low gamma means price can move without dealers needing to do much.
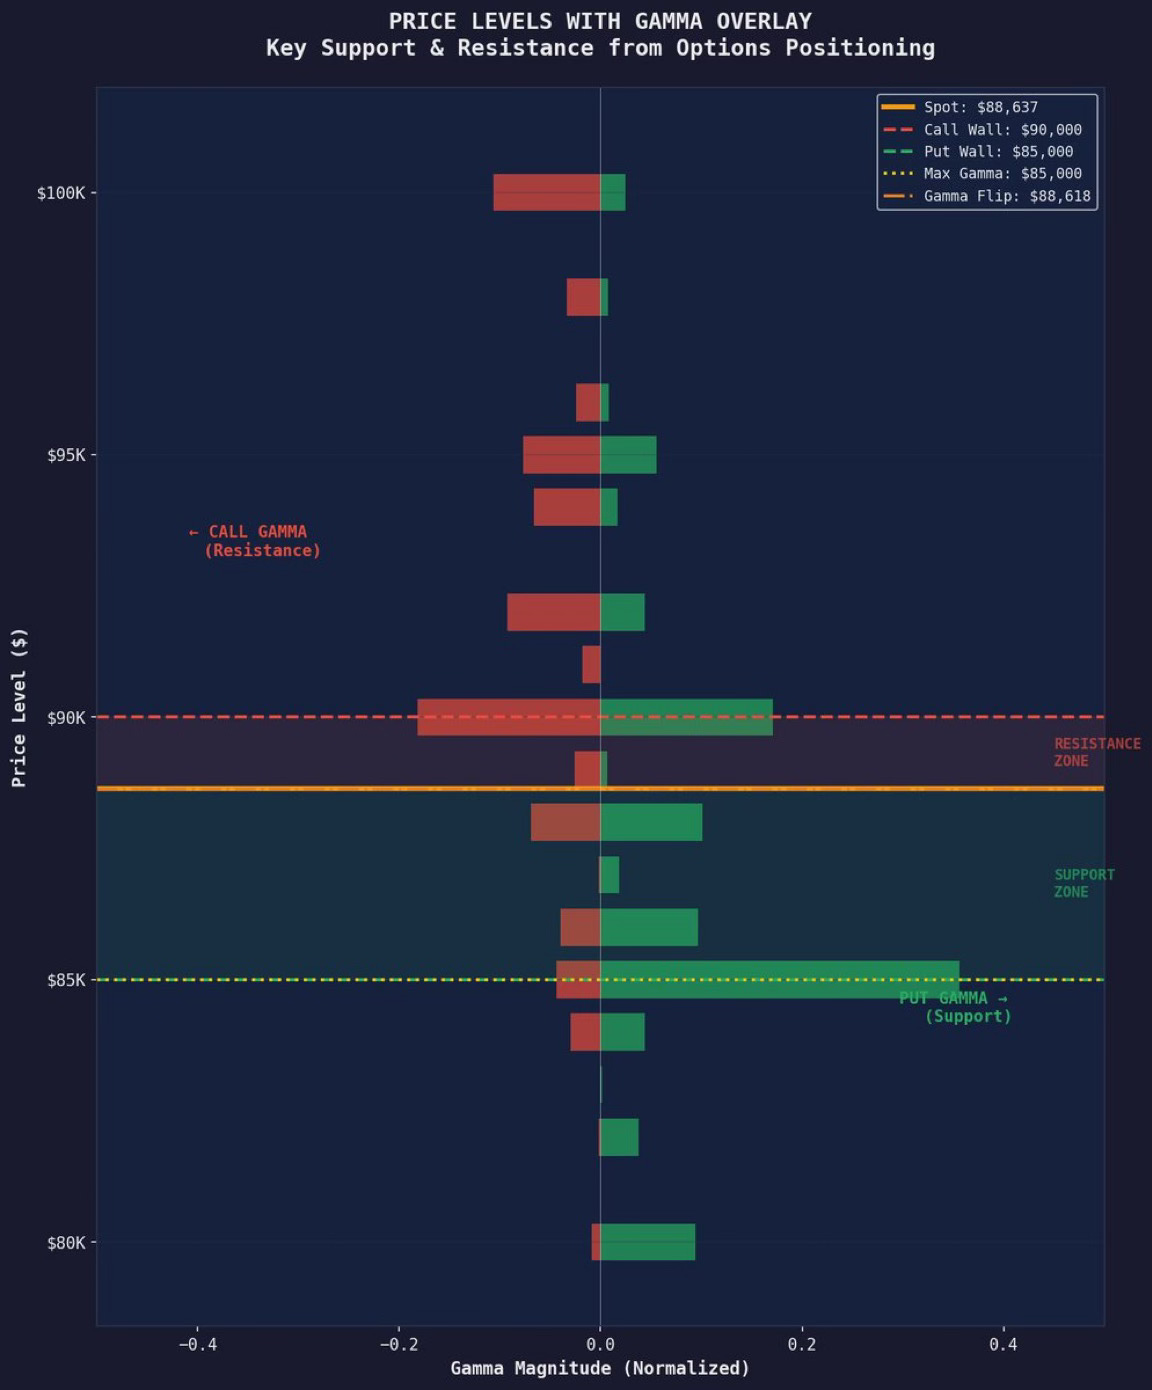
Right now, Bitcoin has enormous gamma concentration between $85,000 and $90,000. Dealers are extremely sensitive to price moves in this range. They have to trade constantly to stay neutral.
The “Gamma Flip” at $88,618
This is where it gets massively wild.
There’s a specific price level—$88,618—where dealer behavior completely inverts. It’s called the gamma flip point.
Above $88,618 (heading toward $90,000):
Dealers sold massive amounts of $90,000 call options
As price rises, those calls become more valuable
Dealers have to SELL Bitcoin to hedge their exposure
This creates a ceiling—every rally gets sold into
Price gets pushed back down
Below $88,618 (heading toward $85,000):
Dealers sold massive amounts of $85,000 put options
As price falls, those puts become more valuable
Dealers have to BUY Bitcoin to hedge their exposure
This creates a floor—every dip gets bought immediately
Price gets pushed back up
Result: Price is magnetized to $88,618. It’s trapped.
Try to rally? Dealers sell. Try to dump? Dealers buy. The price just... stays pinned.
Looking at my daily Ichimoku chart, my cloud bottom (Leading Span A) sits at $88,350. My 4-hour Kijun (base line) is at $88,450.
The Ichimoku system detected the exact same level the options market mechanically created: $88,618.
My technical analysis was picking up the structure, but I didn’t understand why that structure existed until I learned about gamma.
After reading derivatives analysis for days, I needed to understand the trick being played.
Here’s what’s happening: Dealers create artificial walls by hedging their options positions. Above a certain price, they’re forced to sell. Below it, they’re forced to buy. This pins Bitcoin in a narrow range - not because of supply and demand, but because of mechanical hedging requirements.
The range feels calm, but it’s unstable. It exists only because massive options positions haven’t expired yet.
December 26, more than half of these positions expire. The walls disappear, the forced buying and selling stops. Price can finally move freely.
The structure favors downside initially - when price is below the flip point, dealer hedging amplifies moves instead of dampening them. Falls accelerate faster than rallies.
This is controlled tension with a known release date. The cage has a timer.
Would that lead to panic? No - not if you understand the mechanics of how Bitcoin is behaving trapped in the ETF infrastructure.
This is what happens when Wall Street brings its derivative playbook to a new asset. The tools that manage volatility in traditional markets now manage Bitcoin’s price action. Understanding the mechanics removes the fear.
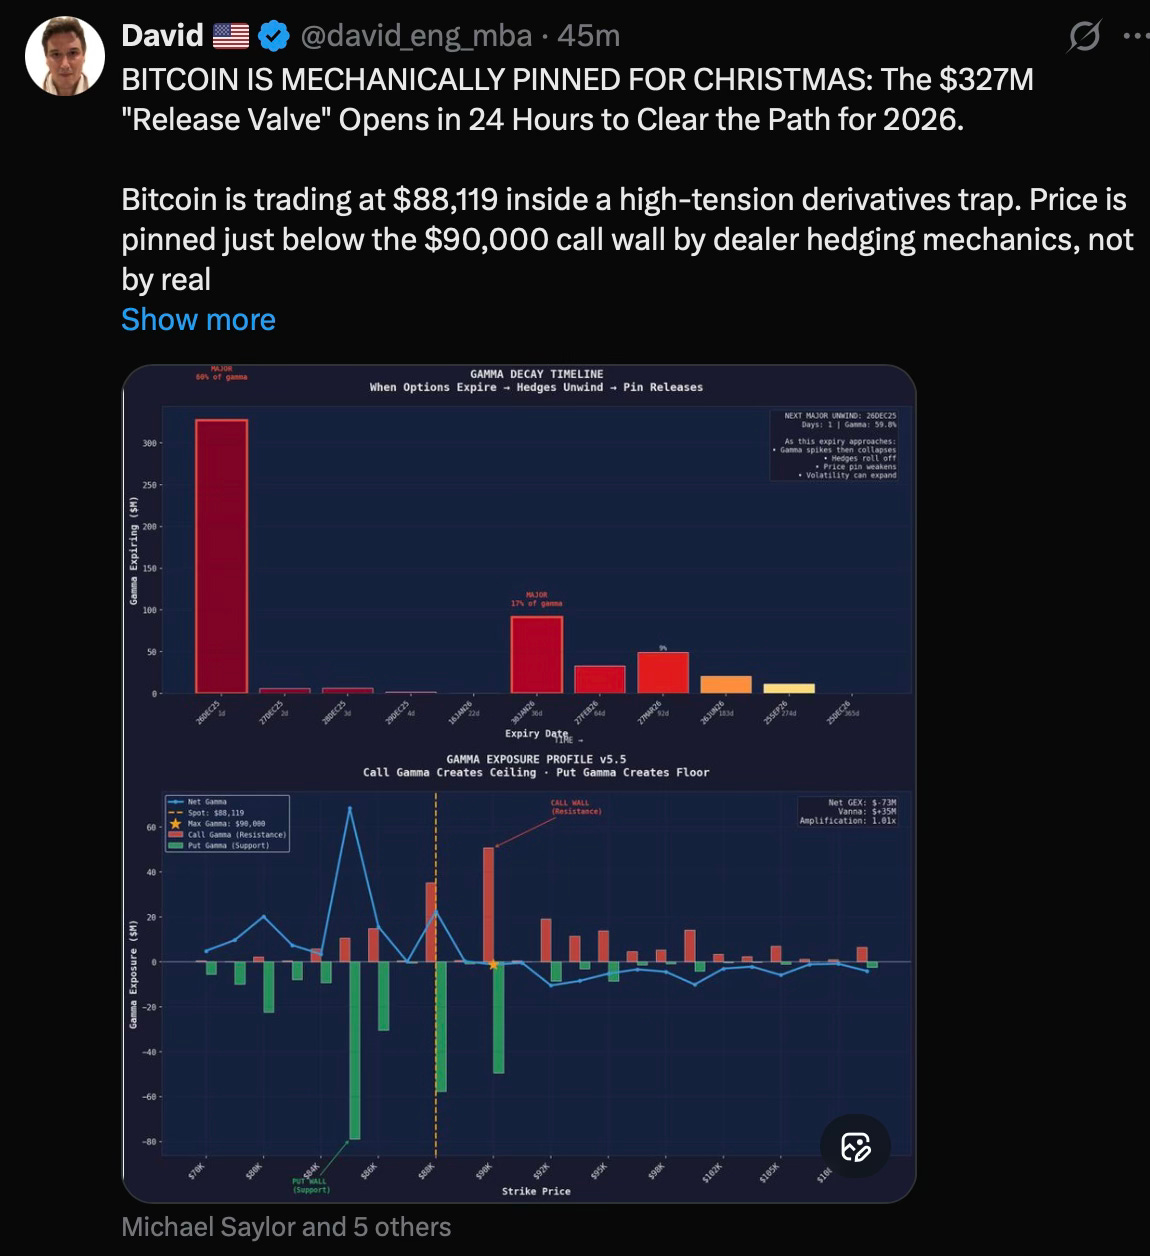
The Current Setup: What The Numbers Show
The gamma positioning chart below visualizes what I'd been feeling in my Ichimoku analysis for weeks - price trapped between structural walls. The massive December 26 spike shows more than half the market's gamma concentration expiring in one day. When that bar disappears, so do the mechanical constraints. "While studying why my Ichimoku charts weren't resolving despite clear bearish structure, I came across this analysis from @david_eng_mba explaining the derivatives mechanics behind the $85-90K range. This helped me understand WHY the structure existed, not just THAT it existed."
How ETFs Changed Everything
Before January 2024—before Bitcoin ETFs launched—this market worked differently.
Bitcoin mostly traded on crypto exchanges. Retail + whales drove the narrative. There was less derivative sophistication. Price moved on “number go up” sentiment and Twitter narratives.
After January 2024:
Wall Street infrastructure arrived. Sophisticated options market makers entered. Mechanical hedging flows started dominating short-term price action.
Now price moves when structures allow it, not when retail wants it.
I noticed this in my own analysis. I’ve been tracking Ichimoku for months, and something changed this year. The charts started showing bearish setups that just... wouldn’t resolve. Price would get pinned in ranges that made no technical sense.
Now I understand why.
The sentiment of the market right now is not regulated by people. It’s regulated by mechanical constraints.
The ETFs brought institutional money, which is great for long-term adoption. But they also brought institutional control mechanisms—derivatives, hedging, gamma walls—that trap price in artificial ranges.
I wrote about this structural entanglement in December, exploring how Bitcoin's astrological chart reveals that it was never designed to stand completely outside institutions. Instead, it serves as infrastructure and bridge—carrying value through existing rails while those rails mutate. The ETFs, Tether's reserves, the derivatives we're examining here—all of these show Bitcoin doing a job inside fiat's nervous system rather than transcending it entirely.
Further Reading: For a deeper exploration of Bitcoin's structural relationship to institutions through the lens of evolutionary astrology, see my December 03 2025 article:
How Much Control Does Retail Actually Have?
Here’s the brutal answer to my original question:
Right now (December 24-26): About 5%
With 54% of market gamma expiring on December 26, dealers control 85-90% of marginal price movement. Retail can “push” price toward the walls, but dealers determine whether it sticks.
My evidence? Volume at 47% of average. Retail has given up trying to move price. They know it’s pinned.
After expiry (December 26 - mid-January): About 30-40%
Once the gamma expires, the mechanical walls disappear. Volatility returns. Retail + algorithmic traders + momentum funds can drive directional moves.
This is when we’ll see actual price discovery again—the 2-3 weeks after major expiry when derivative constraints are lowest.
Long-term (multi-month): About 15-25%
Institutional positioning (ETFs, MicroStrategy, large holders) sets the macro trend. Retail creates noise and local swings but can’t change the overall direction without hundreds of millions in actual capital.
The power hierarchy looks like this:
Central bank policy (liquidity conditions) = 40%
Institutional spot buyers (ETFs, corporates) = 30%
Derivatives dealers (options market makers) = 20%
Large speculators (hedge funds, whales) = 5-7%
Retail traders = 3-5%
So Who Makes Money Here, and Why Should Retail Keep Holding?
Who profits from this setup:
The options dealers aren’t making directional bets - they’re collecting premiums and spreads while staying neutral. They make money whether price goes up or down, as long as they can hedge efficiently. The real winners in this range are the market makers facilitating the trades, not the traders trying to guess direction.
Traders who bought calls at $90K hoping for a breakout? They’re watching their options expire worthless on December 26. Traders who bought puts at $85K hoping for a crash? Same outcome. The mechanical pinning ensures maximum option decay for both sides.
Why retail should keep holding:
This is where understanding the mechanics actually matters for decision-making.
If you’re holding actual Bitcoin - not trading options, not using leverage - the December 26 expiry changes nothing about Bitcoin’s fundamental properties. Your Bitcoin is still your Bitcoin. The mechanics I’m describing explain short-term price constraints, not long-term value.
The cage opens December 26. Price will move. But trying to trade around these mechanical constraints is exactly how retail loses to institutions. The dealers have the data, the speed, the capital, and the systems. You don’t.
What I’m doing: Holding. Studying. Documenting. Not trading the noise.
The volatility spike after expiry will create opportunities for traders - and traps for most of them. The difference between a 5% drawdown and a 20% drawdown matters enormously if you’re trading. It barely matters if you’re saving in Bitcoin over years.
Understanding gamma walls and dealer hedging helps me comprehend WHY price behaves the way it does. It doesn’t tell me to sell my stack because some options are expiring.
The mechanics explain the cage. They don’t change what Bitcoin is or why people hold it.
What Happens December 26?
Here’s why that date matters so much.
On December 26, 2025, $278 million in options gamma expires. That’s more than half the entire market’s positioning.
When these options expire:
The contracts cease to exist
Dealers no longer need to hedge them
The gamma exposure disappears
The walls vanish
The floor and ceiling turn off
It’s like someone suddenly removing the bumpers from a bowling lane. The ball can finally go anywhere.
My Ichimoku analysis shows:
Weekly: Six weeks in cloud, near breakdown below $86,000
Daily: Below all elements, bearish structure
4-Hour: Below cloud since December 21, compressed tight
Low volume everywhere, no conviction
My other timing frameworks show:
Mars geocentric 120° trine completed December 23 (harmonic support)
New 260-day Mars square cycle just began
Venus approaching 90° in 22 days (next geometric marker)
My expectation (not trading advice, just analytical framework):
The period from December 26 through mid-January should show:
Volatility spike (first 24-48 hours could be violent)
Likely direction: down (all timeframes show bearish structure)
Target zone: $78,000-$82,000 (my weekly cloud bottom support)
Volume returning as participants re-engage
I have geometric angles and cycle analysis pointing to mid-January as a potential temporary bottom or consolidation point. But the catalyst is December 26.
That’s when the cage door opens.
The Frustrating Reality
Here’s what’s frustrating about all this:
I spent months learning Ichimoku, studying cloud dynamics, Chikou Span confirmations, multi-timeframe confluence. I got pretty good at reading price memory and momentum.
But it doesn’t matter right now. My charts are screaming “bearish breakdown imminent,” and price just... sits there.
Because I was analyzing retail psychology and technical structure, while the actual control was institutional hedging mechanics that don’t show up on a chart.
This is why I needed to understand options, gamma, derivatives; to understand what’s actually controlling price when my technical analysis shows one thing and price does another.
The charts still work. Ichimoku is still detecting important levels—my cloud bottom at $88,350 lines up almost perfectly with the $88,618 gamma flip. The system is picking up structure.
I just didn’t understand WHY that structure existed until now.
How Long I’ve Been Watching This
Week of December 1-7, 2025:
Bitcoin trapped in 88-94k range with exceptionally low volume. The week moved only +36 points (+0.04%) despite a 10k intraday range. Tuesday’s rally to 93k failed at daily Kijun resistance (94k), volume collapsed 40% on rejection. No day exceeded normal volume averages - neither bulls nor bears have conviction. Classic indecision/consolidation: mathematical structure (Ichimoku levels) without emotional commitment (volume) produces range-bound noise. The 88-94k range remains a prison until volume arrives.
This was three weeks ago. I documented it, published it, and waited.
Two Weeks Later (December 21):
Two weeks ago, I mapped convergence: December 18-23 would bring Chikou Span meeting Kijun Sen, Mars 260-day square completing, Winter Solstice marking Gann’s 270° cardinal point. Multiple timing systems pointing to same window.
The market responded with nothing.
I skipped last week’s report because there was nothing to report. Price oscillated 86-90k, Kijun acting as both ceiling and floor. Volume broke down to 30-40% of averages. The 88-94k prison simply tightened its walls.
This is what waiting looks like - candles going sideways while the mathematics mature.
Then I learned about the gamma mechanics. Suddenly it all made sense. I wasn’t wrong about the structure - I was just analyzing one layer (Ichimoku technical structure) while missing the layer underneath it (derivatives mechanics creating that structure).
The 88-94k “prison” I kept documenting? That was the gamma walls. The volume collapse? That was retail giving up trying to move price they couldn’t control. The Kijun acting as “both ceiling and floor”? That was the $88,618 gamma flip point my Ichimoku detected at $88,450.
My analysis was picking up the cage. I just didn’t know WHY the cage existed.
The Bigger Picture
So retail people like me have very little control right now. About 5%. Maybe less.
Dealers create the rails. Retail can push the train along those rails, but we can’t change which track the train is on.
The exception is when massive spot buying occurs—like MicroStrategy dropping $5 billion. That can overwhelm dealer hedging. But that requires institutional-scale capital, not retail.
Here’s what I’m watching:
December 26-27: How violent is the initial move after gamma expires?
Volume change: Does participation return as the range breaks?
Which direction confirms: Down through $86K (bearish) or reclaim $88.6K (invalidates bear case)
Mid-January behavior: Does price find support around $78-82K as my framework suggests?
I’m documenting it, building a framework to understand when retail CAN influence price (post-expiry windows, low derivative concentration) versus when retail CANNOT (high gamma concentration, mechanical pinning).
This is structural analysis.
I’m not saying “price will go to X because I think so.” I’m saying “price is constrained by Y forces until Z date, after which it can move to levels A, B, or C based on which support structures hold.” That’s proper analysis.
What I Learned
Nearly two years after ETF approval (01//10/2024), Bitcoin has become something different; it’s still the same asset, same blockchain, same 21 million supply cap.
But the market structure changed; big Wall Street bros entered the chat, and with Wall Street came the tools they use in traditional markets: sophisticated derivatives, gamma hedging, mechanical pinning.
My technical analysis still works—it’s detecting the levels these mechanics create. But understanding the mechanisms BEHIND the levels gives me context my charts alone can’t provide.
When my Ichimoku shows bearish structure but price won’t move, I used to think I was wrong. Now I check: is there massive gamma concentration? Are we approaching an expiry date? What are the dealer hedging requirements?
Often, I’m not wrong about direction. I’m just early because the structure hasn’t been allowed to resolve yet.
December 26 is when it gets permission to resolve.
A Note on Bear Market Confirmation
When I say my charts show “bearish structure,” I’m describing what the indicators are telling me right now - not declaring a confirmed bear market. The Chikou Span crossing below the Kijun would be one confirmation signal, but proper bear market confirmation requires multiple timeframe validation and sustained price action below key support levels ($80k - $85K).
What we have now is bearish setup with mechanical constraints preventing resolution. After December 26, if price breaks below $86K and holds below $80k, if volume confirms the move, if my weekly cloud gets broken - then we can talk about bear market confirmation. Until then, this is a bearish structure waiting for permission to either confirm or invalidate.
The mechanics tell us WHEN the cage opens. The price action after that tells us WHERE we’re actually going.
This is educational analysis, not trading or investment advice. I’m studying market structure, documenting patterns, building analytical frameworks. Always do your own research.
Thanks to the derivatives analysts who helped me understand the mechanics behind what my charts were showing me.
A great analyst observes behavior and also takes time to study all elements.
The Future is Uncertain

Two weeks ago, I mapped a convergence: December 18-23 would bring the Chikou Span to meet the Kijun Sen, Mars geometric cycles completing their 260-day square, and the Winter Solstice marking Gann’s …

A monetary mirage that visibly reveals the magic trick

Is your value pegged to your priced possessions, your cherished relationships, your status, or simply to your truth? How can you trust yourself to make the right decisions about your time on earth?
Wow, the part about your charts showing one thing yet price does another really resonated. It perfectly illustrates that fascinating gap between tehnical predictions and real-world system behavior. Your LLM approach is super smart for digging into those non-obvious drivers. Makes you think about feature engineering in complex models, doesn't it?