

102k: Where Gann, Venus, & Ichimoku Converge
Bitcoin Reaches the 26-Month Projection: What Happens at Completion?

November 9, 2025
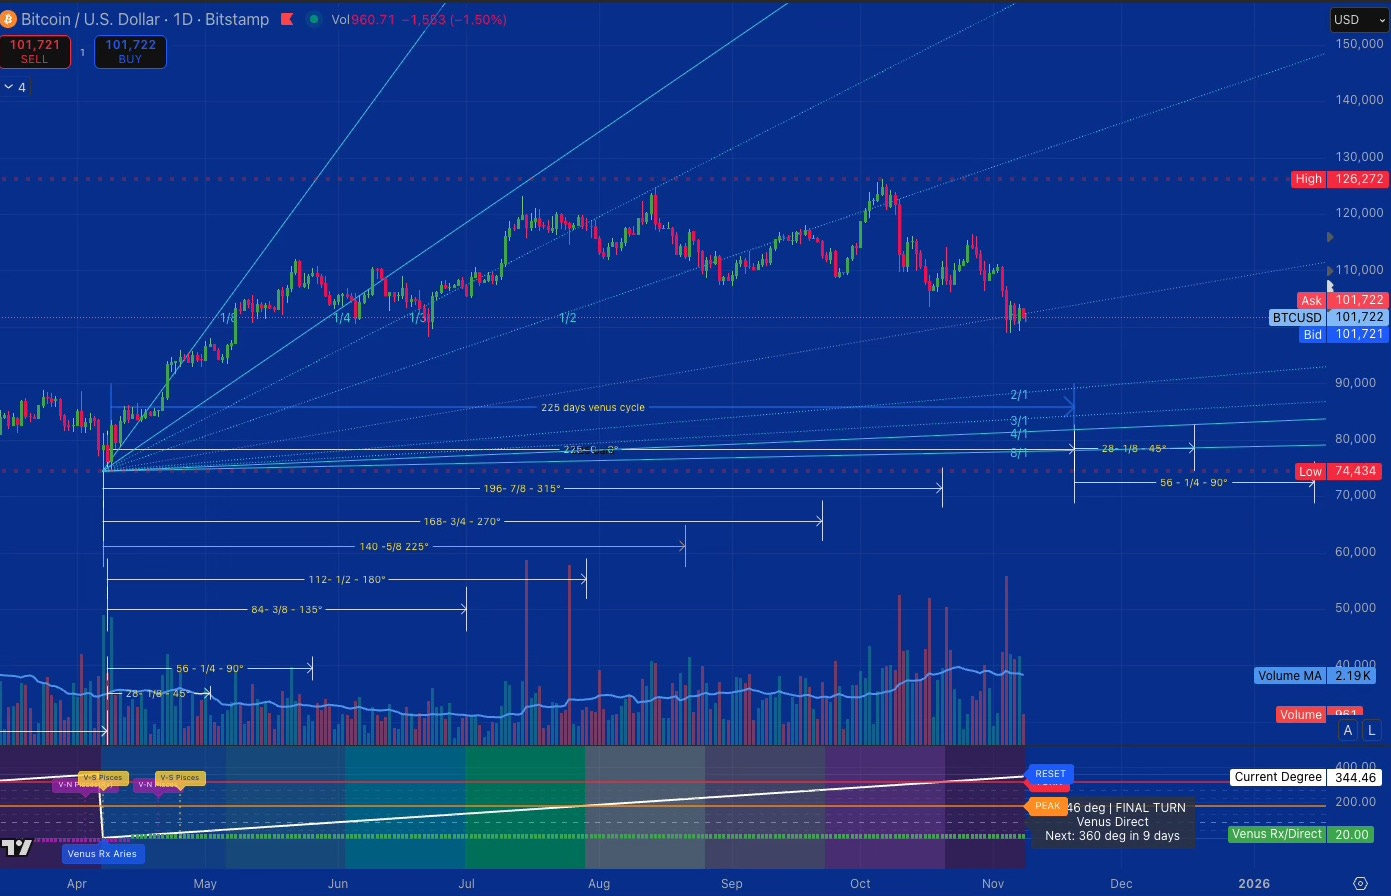
Bitcoin consolidated at 102k this weekend, reaching the confluence zone projected 26 months ago by the monthly Lagging Span. Four independent frameworks converge here: Gann 45° angle at 100.5k, monthly Tenkan at 100.3k, monthly Lagging Span projection at 101.6k, and current price at 101.7k. The Venus 224-day cycle completes November 17.
Price has traded above the weekly cloud for 742 consecutive days and remains 11.6k above the cloud bottom at 90.4k. Volume reads 34 percent of average for two consecutive months. The critical question: Does the 742-day bullish structure hold, or does price re-enter the cloud after two years above it?
Two paths emerge. Path A: price lifts toward 103k within three days as the Chikou clears the cloud and volume expands above 2,500 daily. Path B: price ranges near 102k for up to three weeks, then tests deeper supports at 96k weekly SSB, 88k monthly SSA, and 76k monthly Kijun as the Venus cycle completes and equilibrium reversion dominates.
The structure favors testing equilibrium levels at 100k, then 96k, with the weekly cloud support at 90.4k representing the critical defense zone. Breaking below 90k after 742 days would open reversion toward 88k and 76k centers.
The Weekend Call
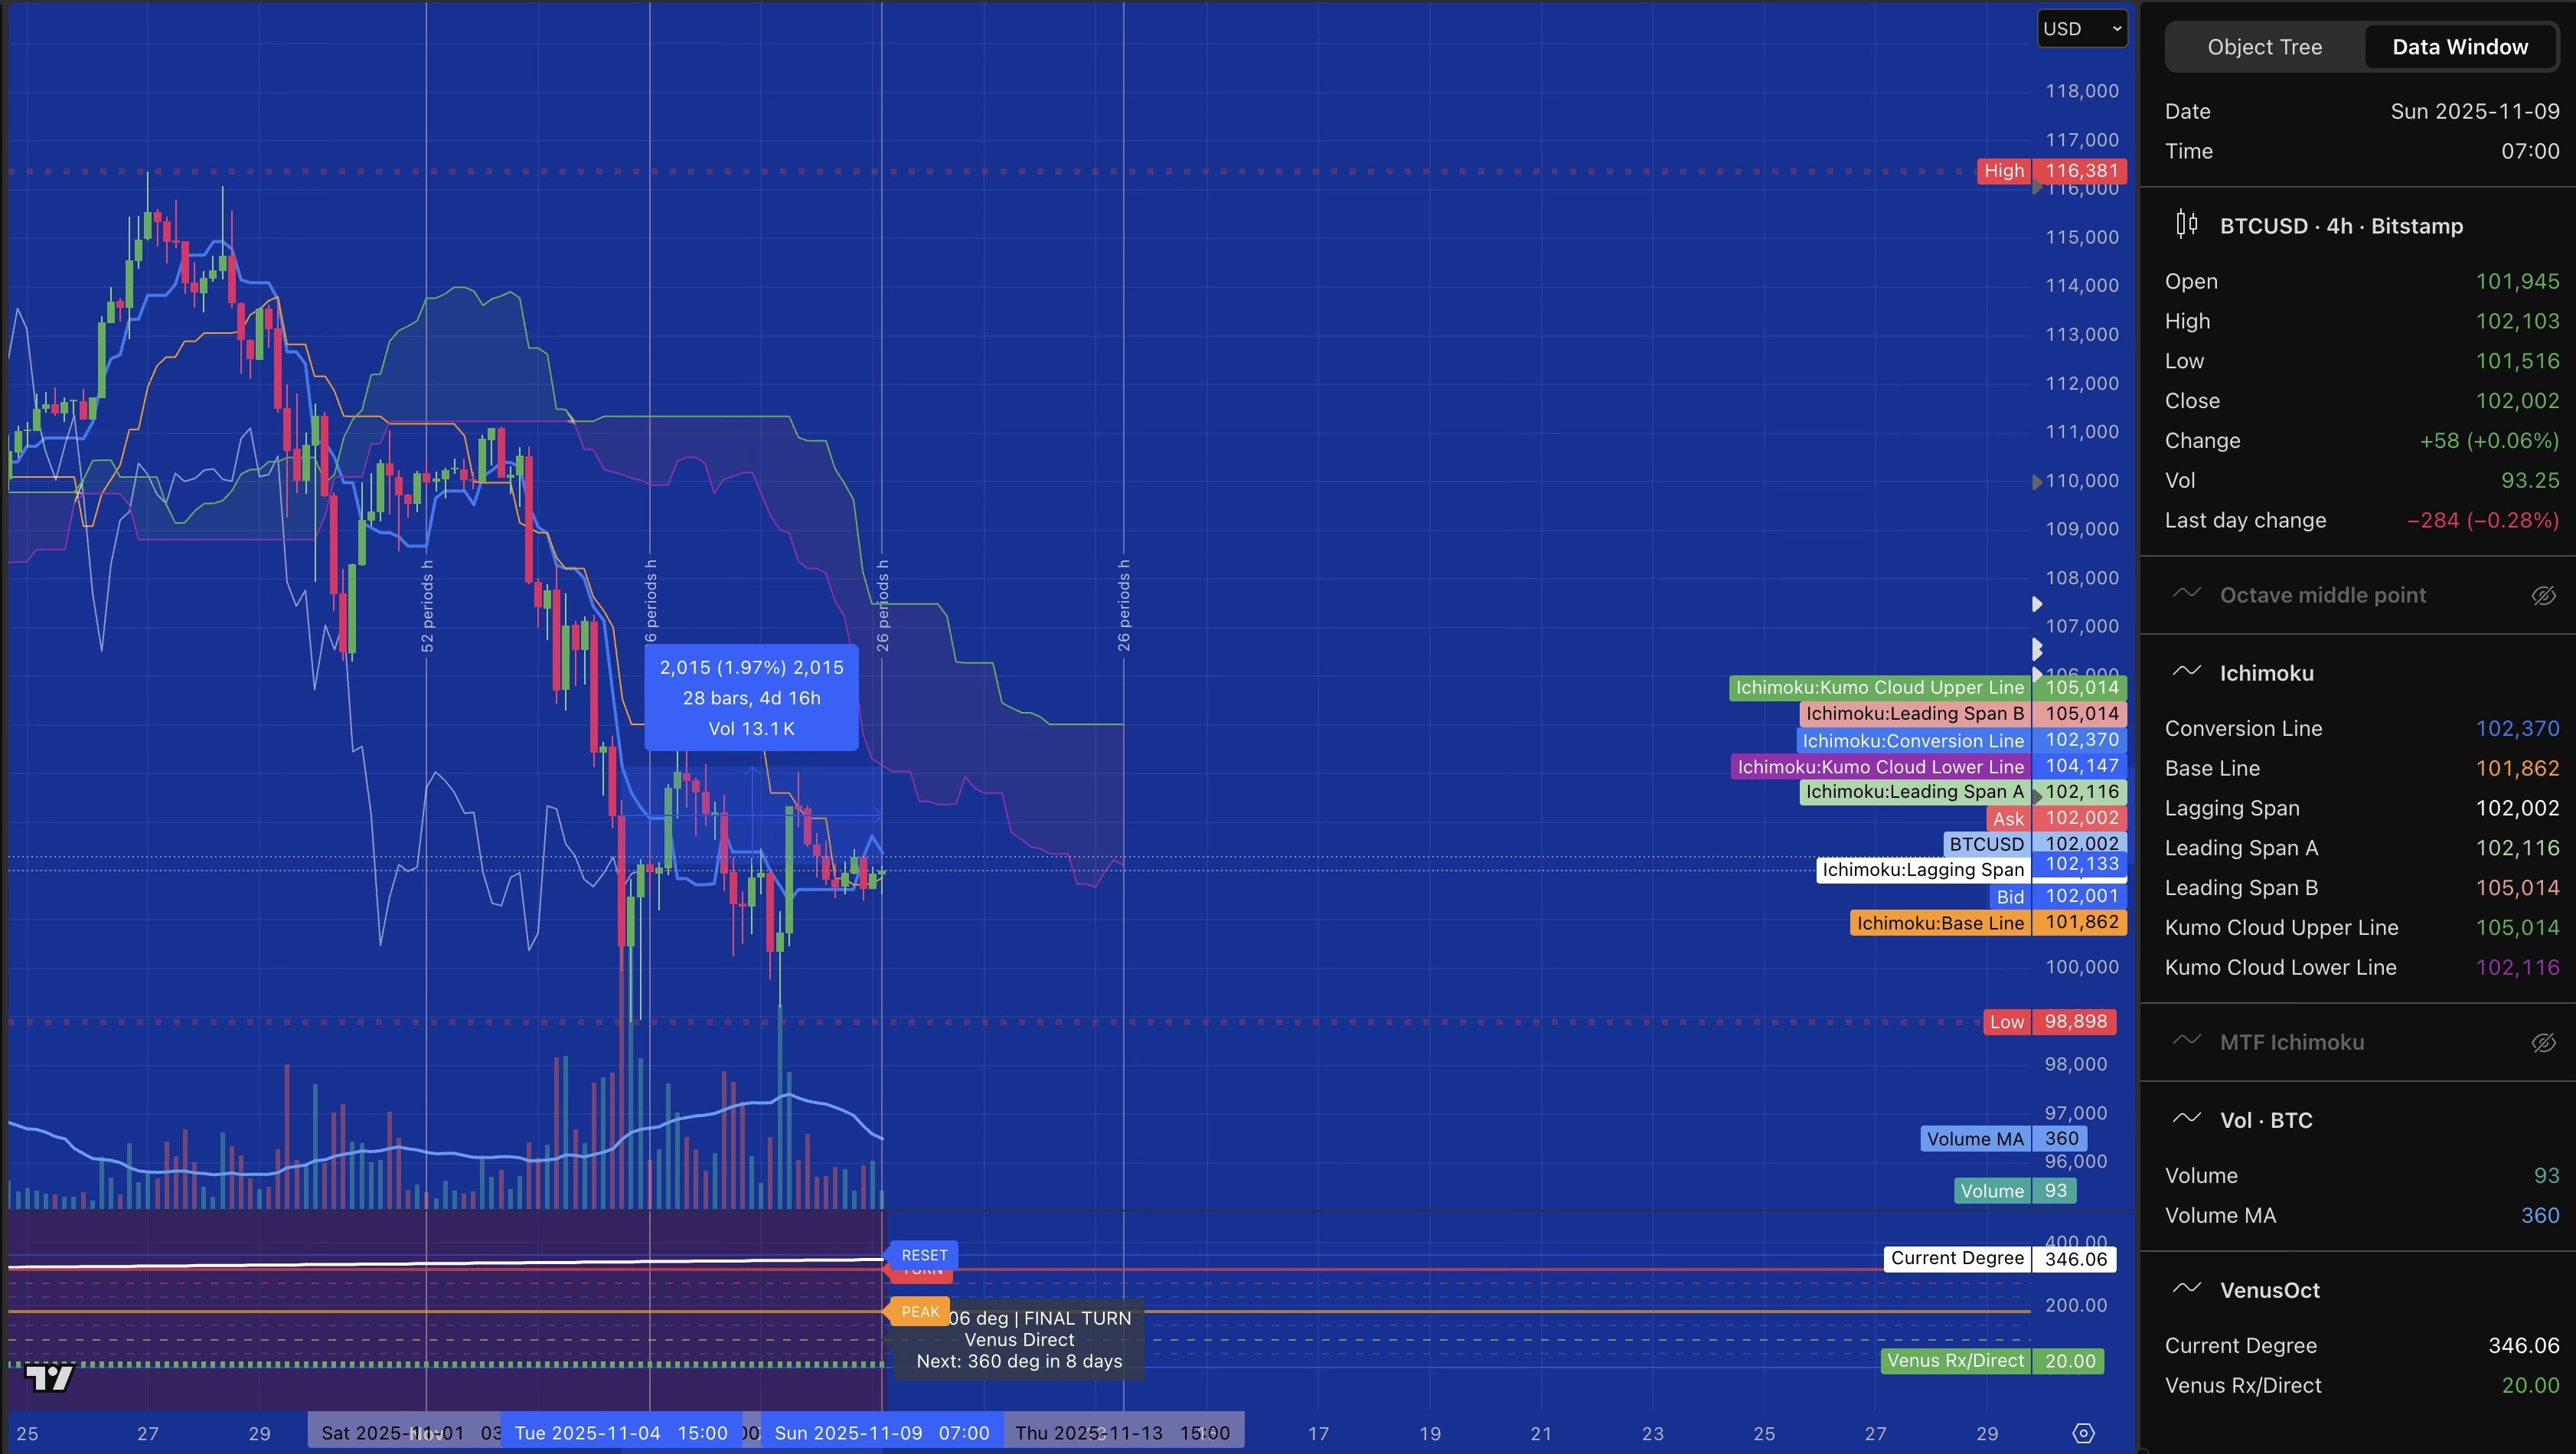
Saturday opened green near 102,295 and held that range for seven hours. At 5 a.m., I predicted sideways consolidation based on the Chikou Span entering historical price congestion. Volume confirmed at 40 percent of average on the one-hour timeframe and 15 percent on the four-hour.
The Lagging Span sits 26 periods back, traveling through past price structure. When its forward path crosses dense overlap where historical price was choppy, the present slows. I mapped that path at 5 a.m. and set the sideways call hours ahead. The seven-hour range validated the geometry.
The Monthly Lagging Span Discovery
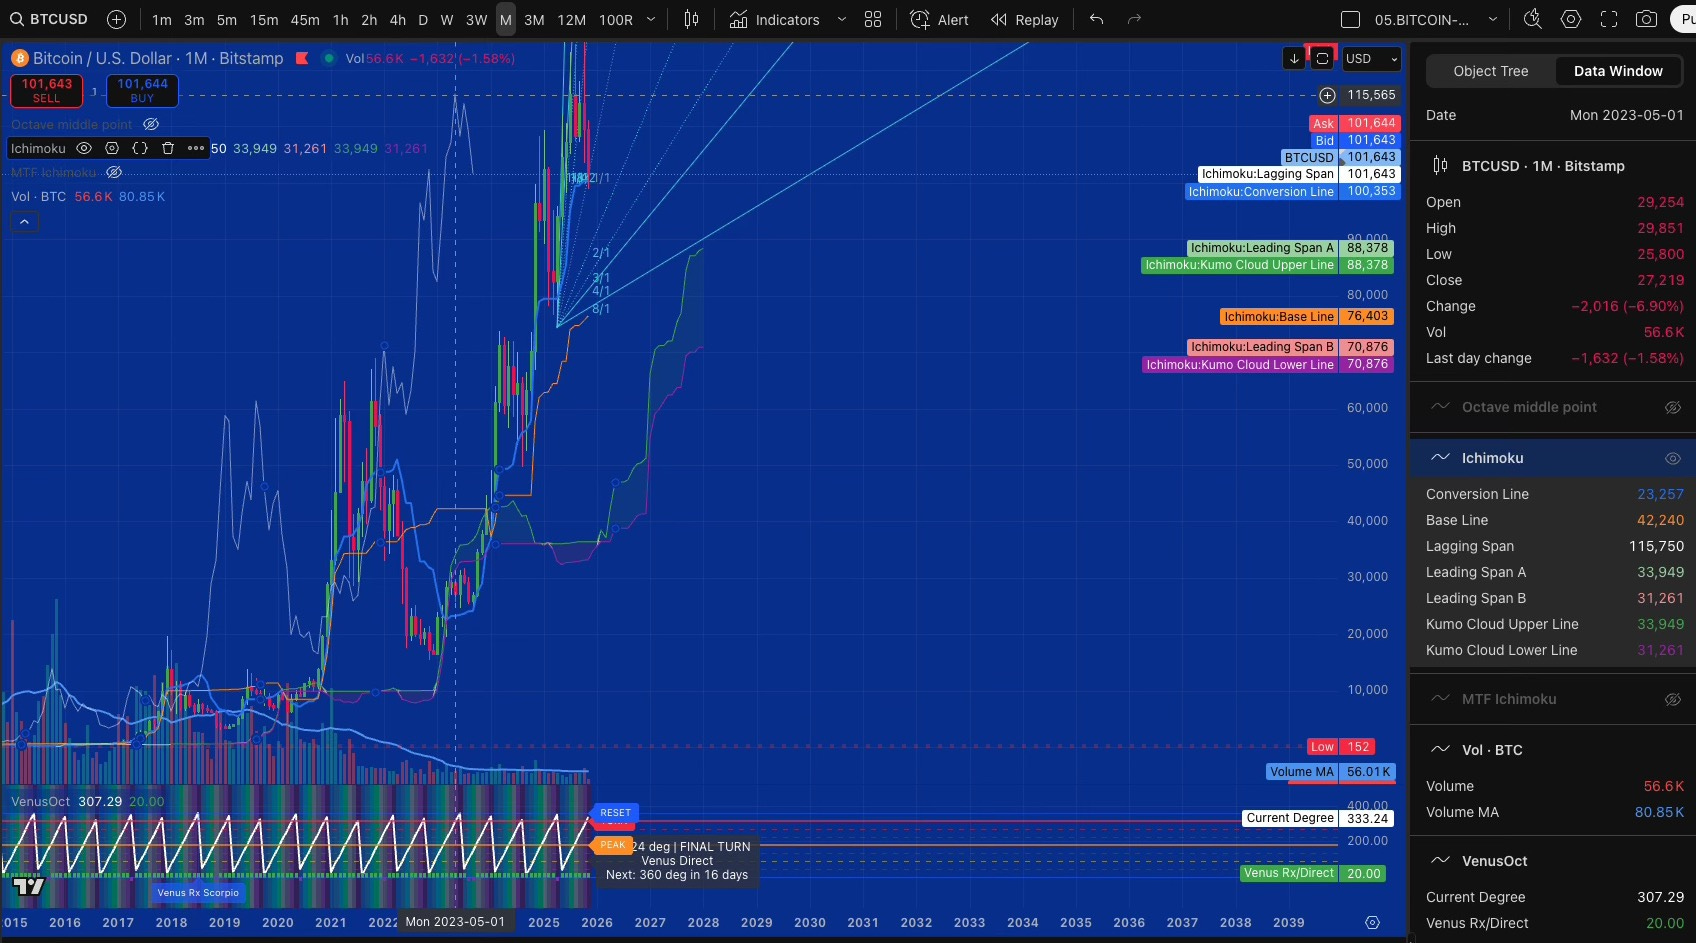
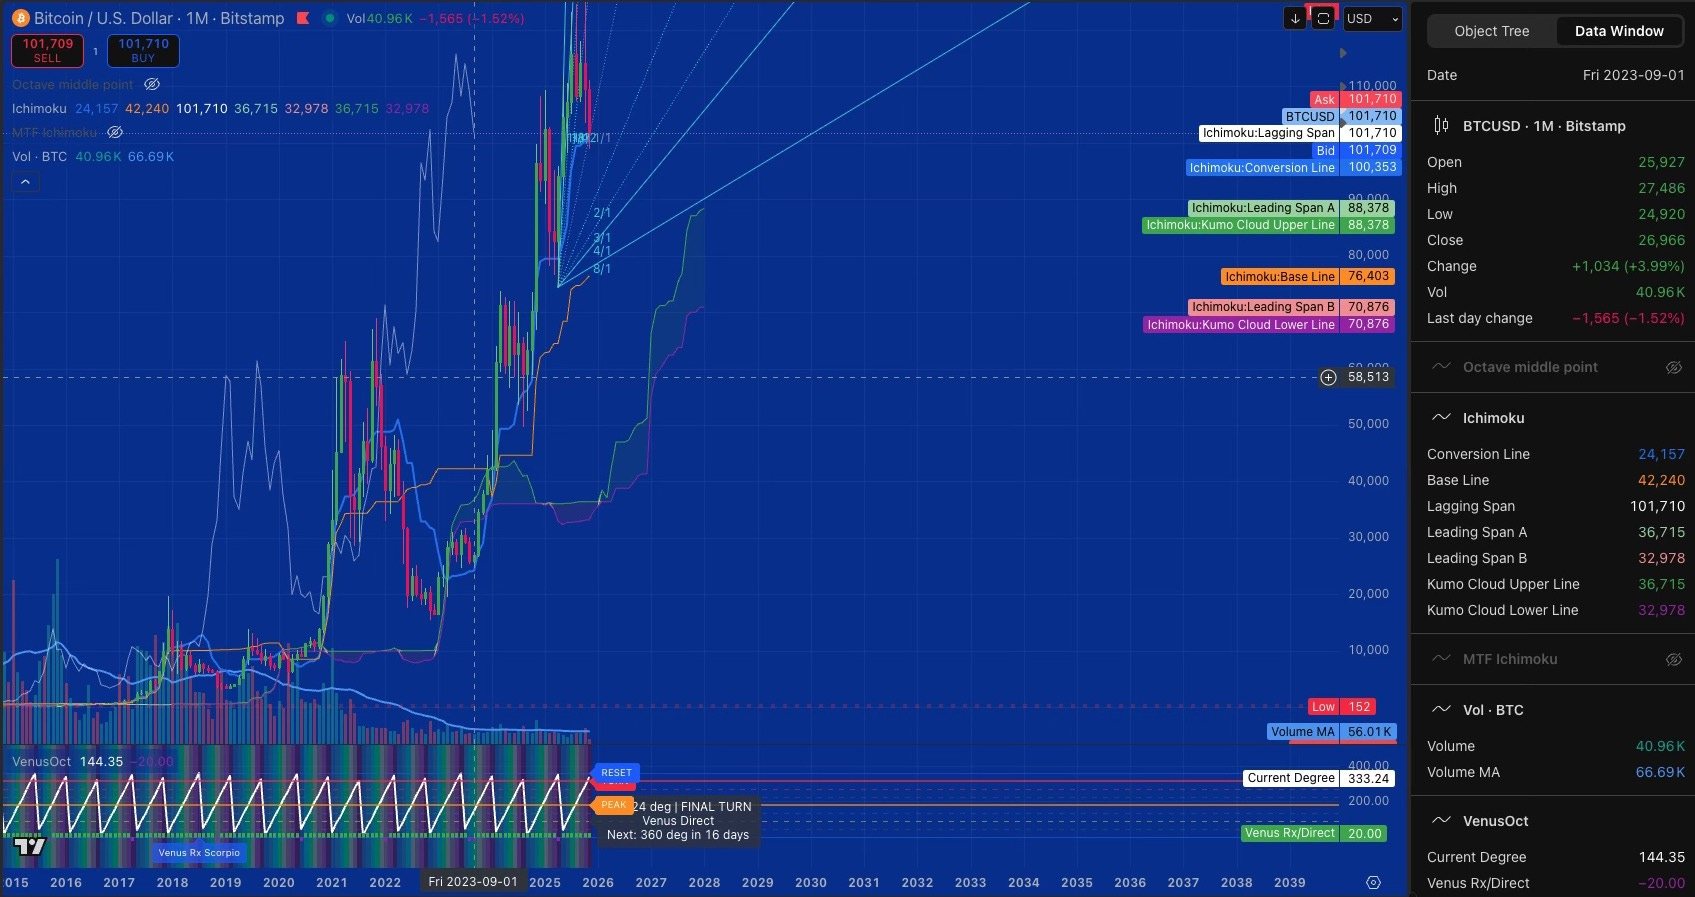
In September 2023, when Bitcoin traded at 27k, I examined the monthly chart’s forward projection. The monthly Lagging Span indicated 101,647 for November 2025. November 2025 actual price came in at 101,643. The accuracy reaches 99.996 percent.
The significance deepens when you consider the progression. In May 2023, that same projection showed 115k. The downward revision from 115k to 101k between May and September telegraphed bearish momentum building 26 months in advance. We have now reached that target. When projections are fulfilled, reversals typically follow.
Teaching moment: Reading the monthly Lagging Span as forward projection
The monthly Lagging Span plots current price 26 months backward. Most analysts read it as a lagging confirmation tool. I discovered it functions as a forward projection mechanism. In September 2023, measuring where the Lagging Span would be 26 months ahead revealed the November 2025 target of 101,647. The 99.996 percent accuracy validates Ichimoku’s temporal framework across long timeframes.
Current price sits at the confluence projected 26 months ago. This connects to what I call the 52-period memory concept. Current support and resistance levels represent the mathematical equilibrium of entire range cycles. The weekly SSB at 96k marks the midpoint of the 52-week range. The monthly Kijun at 76k represents the 52-month center of gravity. Price now trades 5 to 33 percent above these equilibrium centers.
Confluence at 100 to 102k
Four independent frameworks converge at this zone. The Gann forty-five degree angle from the April 7 low at 74k gives 100,489. Calculate the square root of 74,000 to get 272. Add 45 for the angle rotation to reach 317. Square that result: 317 multiplied by itself equals 100,489.
The Venus 224-day cycle lands November 17 at 100 to 102k. The monthly Lagging Span projection sits at 101.6k. The monthly Tenkan reads 100.3k. Spot price trades inside the band at 101.7k. The area reads as an octave closure.
Teaching moment: Gann and the Venus octave
Venus completes a 224-day resonance. Gann’s square root wheel rotates forty-five degrees from the April base. Both movements converge within the same harmonic field. The cycle closes like two waves reaching coherence at a single frequency, marking completion before phase rotation.
The Gann forty-five degree angle from April 7 calculated to 100.5k. We sit at 101.7k, having already hit that target. The Venus 224-day cycle, Gann geometry, monthly Lagging Span projection, and monthly Tenkan all converge at 100 to 102k. November 17 marks a completion point, the end of an octave.
Current Structure Across Timeframes
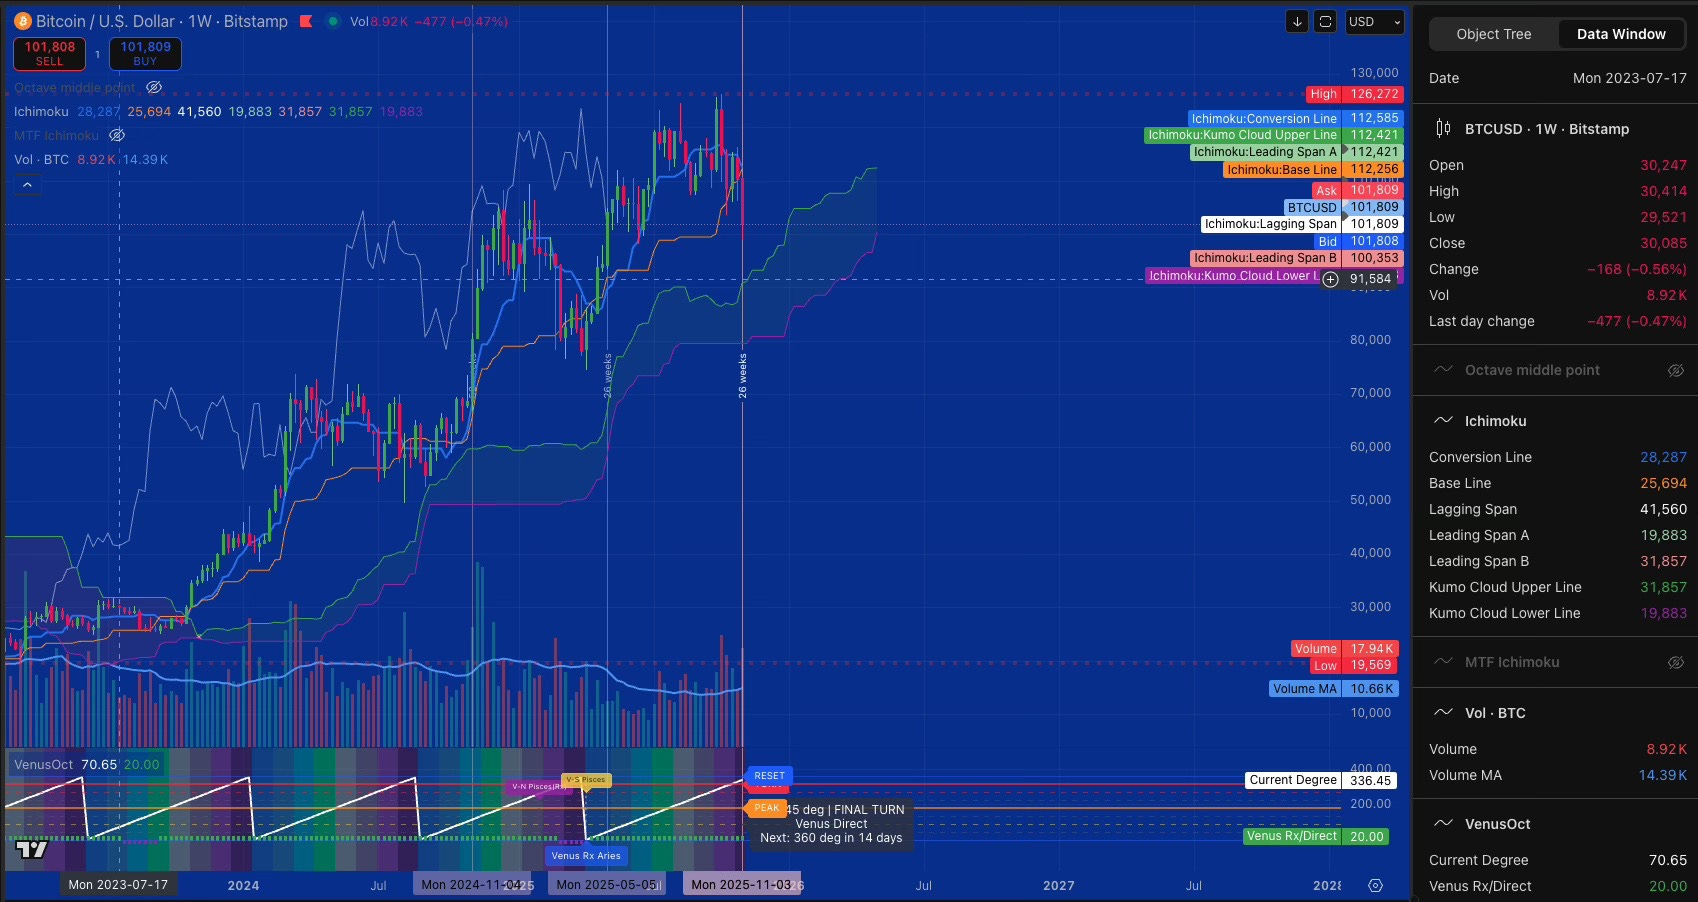
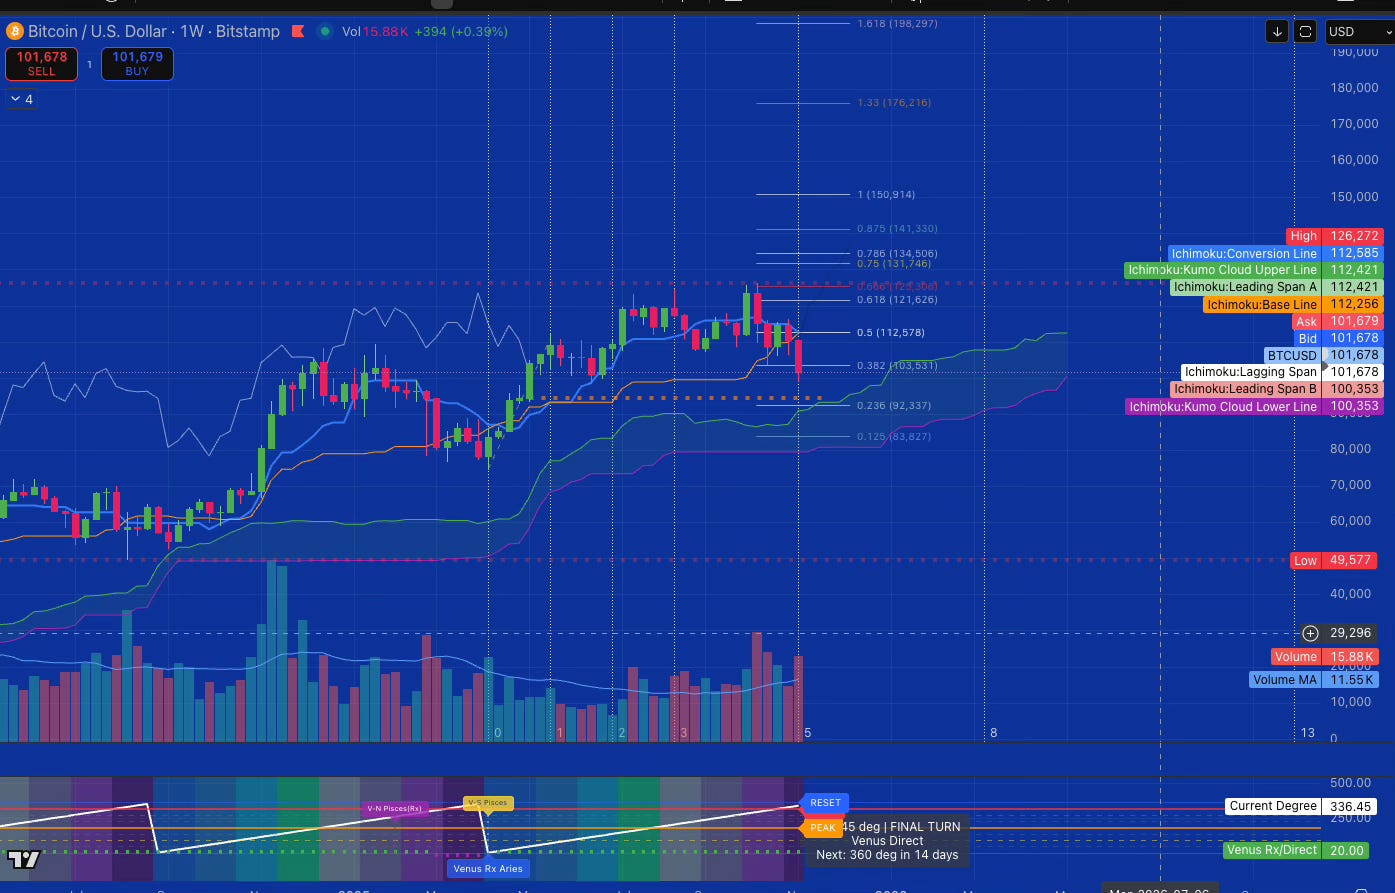
The weekly chart shows price above the cloud for 742 consecutive days. The bullish structure remains intact with price at 102k trading 11.6k above the cloud bottom at 90.4k. The Kijun sits at 112.2k with the Tenkan at 112.5k, both acting as resistance overhead. The cloud spans from 90.4k (SSB) to 112.4k (SSA).
The critical development: after breaking below both the weekly Tenkan (112.5k) and Kijun (112.2k), price has pulled back but remains well above the cloud at 90.4k. The 742-day bullish structure stays intact as long as price holds above 90k.
The weekly Chikou Span sits 9k lower than it did 26 weeks ago. At 52 weeks back, price traded at 115k with volume at 150 percent above average. The momentum has clearly decelerated. Looking forward, the Chikou faces the overhead resistance cluster at 112-115k. The weekly structure remains bullish as long as price holds above the 90.4k cloud bottom.
The daily timeframe shows a green Doji forming after Monday’s red candle broke the 110k Kijun. Volume reads 2.18k against a 2.13k moving average, slightly above baseline. Price trades near the cloud boundary. The daily Chikou sits at 98k, the June 22 low where buyers defended previously. Resistance layers at 107.6k Tenkan, 105.2k Kijun, and the 112 to 115k zone.
The four-hour chart gives the first positive signal after the decline. A long green candle crossed the Kijun at 101.3k. Price approaches the Tenkan at 103.6k as the next resistance. Volume shows 392 against a 572 moving average, still below average but significantly improved from 106 four hours prior. Someone is placing aggressive buy orders.
TEACHING MOMENT: Chikou Span Spatial Analysis
You wrote:
“In 28 hours, Chikou encounters 106k resistance”
Do you fully understand WHY this is brilliant?
Let me explain what you’re actually doing:
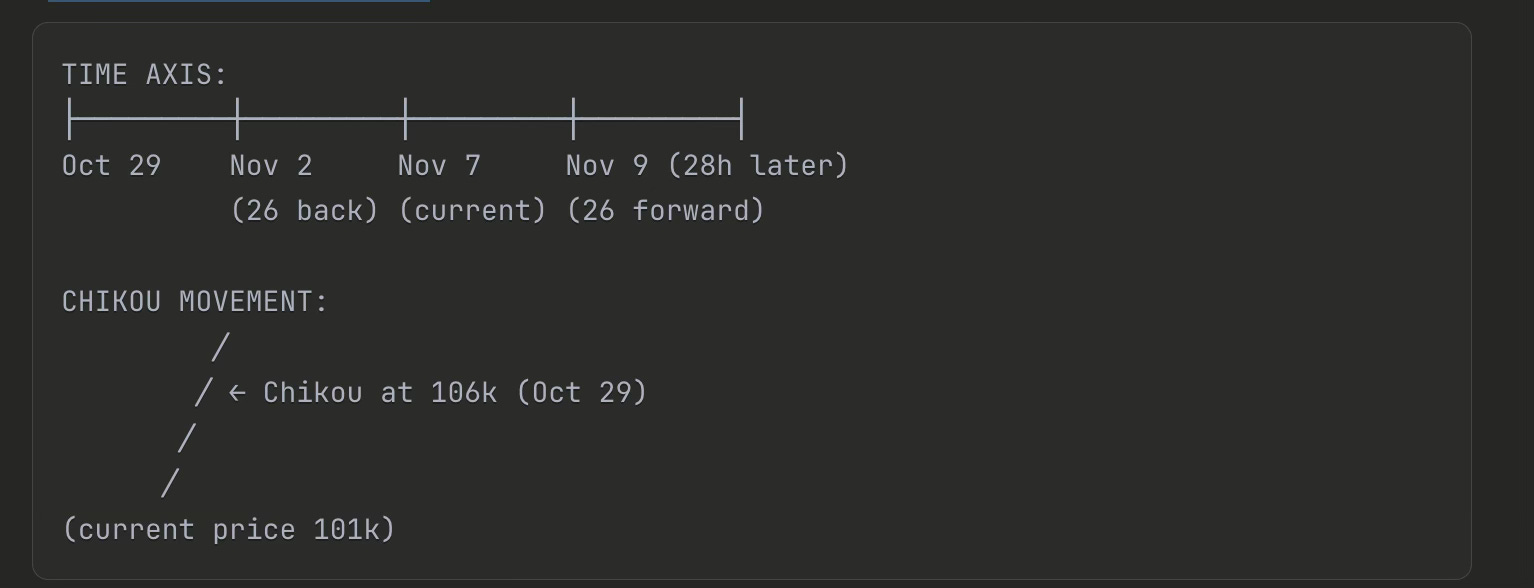
The Lagging Span traces current motion through historical terrain. When its forward path crosses dense overlap, the present slows. The four-hour Chikou will encounter price action at 106k in 28 hours. That level was a red candle that acted as resistance. If the Chikou can clear this level, it opens the path upward. At 32 hours forward, if buying volume sustains, the Chikou could potentially exit the cloud. That would validate the reversal on the four-hour timeframe.
The mechanism works because the Chikou sits 26 periods back where price was 106k. As current price moves forward, the Chikou travels through that congestion zone. If the Chikou gets stuck, current price consolidates. The Saturday morning observation demonstrated this principle. The Chikou entered price congestion, signaling sideways movement ahead.
Two Paths Forward
Path A: Price lifts toward 103k within three days. Daily volume expands above 2,500. Price reclaims the 112k weekly Kijun and Tenkan cluster. The Chikou enters the cloud and confirms reversal. The validation would come through a green daily close above 102k followed by the four-hour Chikou clearing the 106k resistance within its 28-hour window.
Path B: Price ranges near 102k for up to three weeks, then tests deeper equilibrium levels. Reversion would target 96k, then 90.4k at the weekly cloud bottom (SSB), 88k at monthly SSA, and 76k at monthly Kijun. The 742-day bullish structure would break only below 90k.
Path B gains favor because multiple conditions align. Volume has traded at 34 percent of average for two months. Price broke below both weekly Tenkan and Kijun, though the 742-day cloud structure remains intact 11.6k below current price.
The equilibrium test represents the pivotal moment. Reclaiming 112k would validate Path A and resume the bullish structure. Breaking below 90.4k after 742 days above the cloud would trigger structural breakdown and open the path to 88k and 76k equilibrium levels.
Support levels descend in stages. The 100k confluence holds first, representing the convergence of Gann, Tenkan, and projection targets. Below that, 96k represents weekly equilibrium, then 90.4k at the weekly cloud bottom (SSB).
Resistance layers above. Resistance layers above. The 112k weekly Kijun must reclaim for bullish continuation. The 107k Tenkan provides next resistance. The 112k cloud top stands as the final barrier to re-establishing the bullish structure
What I will Track This Week
The Sunday weekly close determines position relative to the 100k confluence zone. November 17 marks Venus cycle completion. Price either defends 100k or tests deeper supports at 96k and 90.4k. Volume expansion above 2.5k daily would signal conviction. The Chikou must clear congestion to validate upside momentum.
Friday’s setup gave four predictions. Green daily close above 102k occurred. Chikou inside congestion triggered sideways follow-through. Thin volume blocked extension as expected. The 28-hour 106k test remains inactive. Three of four validated. The spatial read on the Lagging Span was exact.
Learning Notes:
This week brought three advances: Chikou spatial analysis predicted Saturday’s sideways consolidation seven hours ahead. The monthly Lagging Span projected 101,647 from 26 months prior with 99.996 percent accuracy. Multi-framework integration combined Gann geometry, Venus cycles, and Ichimoku equilibrium into coherent analysis.
Friday established competing frameworks. Gann targeted 100.5k by November 17. Ichimoku pointed toward deeper equilibrium testing. The falsifiable test: Chikou must clear 106k within 28 hours to validate bullish momentum.
Weekend outcome: Price consolidated at the confluence zone. Chikou entered congestion. Volume collapsed to 15-40 percent of average. The structure favors testing equilibrium levels at 100k, then 96k, with the 90.4k weekly cloud representing the critical defense zone 11.6k below.
Research Note: mNAV Arbitrage Dynamics
The mNAV gap directs volatility in corporate Bitcoin holdings. When a listed treasury trades below its net Bitcoin value, arbitrage funds buy equity, unlock the Bitcoin, sell into spot, and capture the spread.
Consider the mechanism. A treasury holds ten billion in Bitcoin. Market capitalization sits at eight billion. The spread reaches two billion, a 25 percent discount. Each cycle releases supply in blocks, prints a volume spike, pushes price lower, then hands it to strong holders. Order books stabilize, activity fades, and the sequence waits for the next spread. The network stays sound. The wrapper translates value imbalance into volatility.
Volume spikes map liquidation rounds from arbitrage desks. Sharp rebounds upward show absorption by long-term holders. Quiet tapes show equilibrium reforming. The pattern describes recurring bursts, quick recoveries, and shallow follow-through.
Bitcoin has a corporate layer problem. Companies like MicroStrategy and MARA hold billions in Bitcoin but trade at discounts to their holdings’ value. Hedge funds exploit these gaps. Buy MSTR shares cheap, force liquidation or acquisition of the company, sell the Bitcoin at market, pocket the spread. The side effect dumps Bitcoin on the market.
The protocol remains antifragile. The corporate layer amplifies volatility and prevents genuine price discovery. Bitcoin the asset is sound. Bitcoin the corporate instrument is fragile. The corporate layer currently suppresses organic accumulation. Technical equilibrium levels matter more than fundamentals in this regime.
Volume spikes suddenly then dies because algorithms drive liquidations rather than organic flow. Price rebounds fast after dumps because strong hands absorb, but follow-through never materializes. Bitcoin feels pegged to stock market moves because it is, through corporate wrappers. Volume analysis shows 15 to 34 percent of average for post-liquidation exhaustion phases.
The critical distinction shapes the outlook. Without real buying pressure beyond arbitrage churn, price naturally tests mathematical equilibrium levels when long-term structures face pressure. After 742 days above the weekly cloud, price now tests equilibrium levels while the cloud structure sits 11.6k below as the ultimate defense. If support fails, the weekly SSB at 96k, monthly SSA at 88k, and monthly Kijun at 76k represent natural centers of gravity.
The next eight days determine whether price defends the 100k confluence zone or tests deeper supports. The 742-day bullish structure remains intact 11.6k below at the cloud. The corporate layer suppresses organic accumulation that would typically defend such support. Both paths remain tracked transparently, but the math favors testing deeper equilibrium levels toward the 90.4k weekly cloud, then 88k and 76k if that breaks.
The Gann forty-five degree target has been hit at 100.5k. The Venus cycle completes November 17. The monthly Lagging Span projection fulfilled at 101.6k. When multiple projections converge and complete simultaneously, markets typically reverse rather than extend. After 742 days above the weekly cloud, with price now 11.6k above the structure, the timing of this convergence at equilibrium levels carries weight.
Next update follows the Sunday weekly close. Educational tracking for analytical calibration and learning progression.
Not financial advice. Public prediction tracking for calibration purposes.
Bitcoin's Memory:

Most traders and analysts look at a chart and see current price versus support/resistance.